

Every quarter, Waymo updates its Safety Impact page with the latest Rider-Only (RO)1 miles driven across its main operating cities2: Los Angeles, San Francisco, Phoenix, Austin and Atlanta. Here’s the latest snapshot through June 2026:
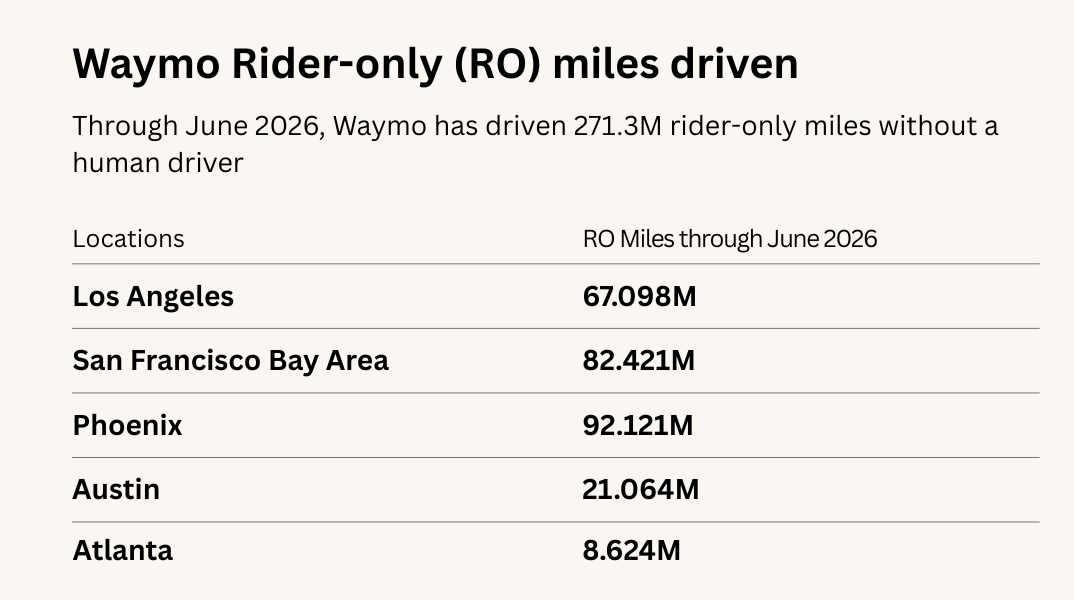
Waymo highlights this data to benchmark its performance against human drivers. And so far, the results have been fantastic. Compared to an average human driver over the same distance in its operating cities, Waymo reports significantly better safety outcomes: 95% fewer serious injury or worse crashes, 82% fewer crashes involving airbag deployment, and 82% fewer injury-causing crashes.

Historical Rider-Only Miles Data
Waymo doesn’t publish historical breakdowns of Rider-Only miles, so to get a better sense of how things are evolving, I’ve been tracking the data by city since mid-20243:
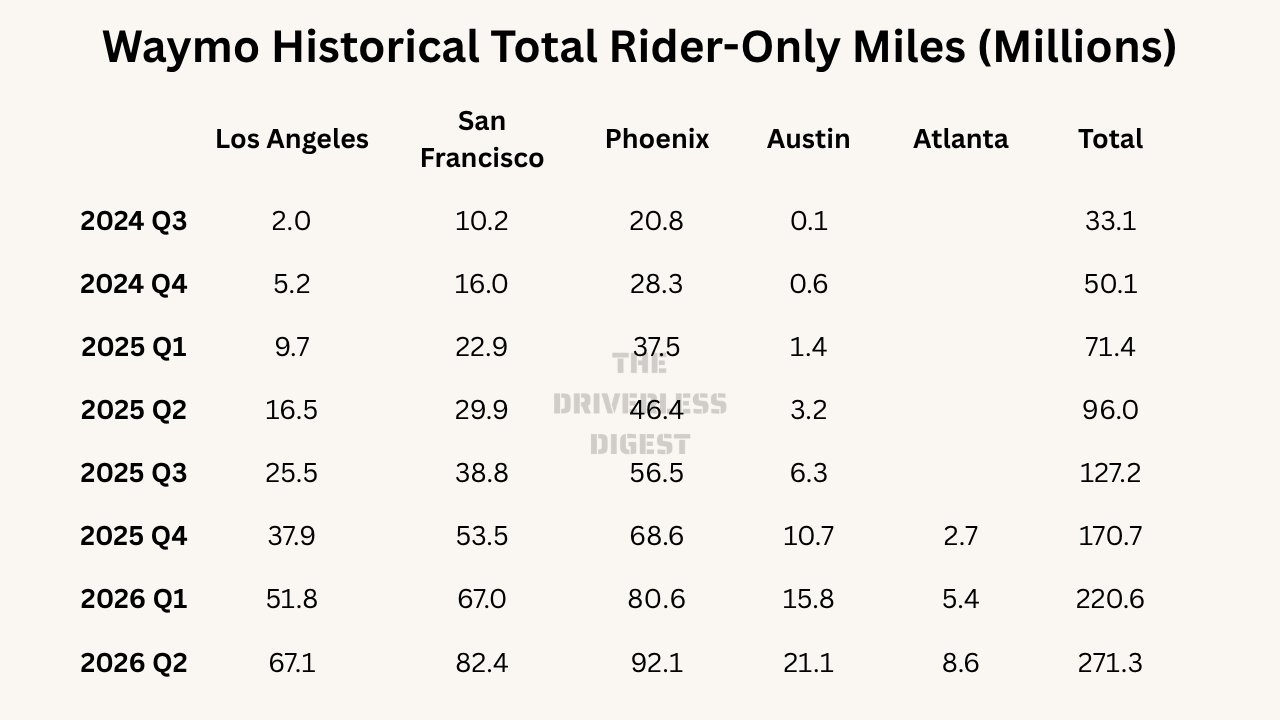
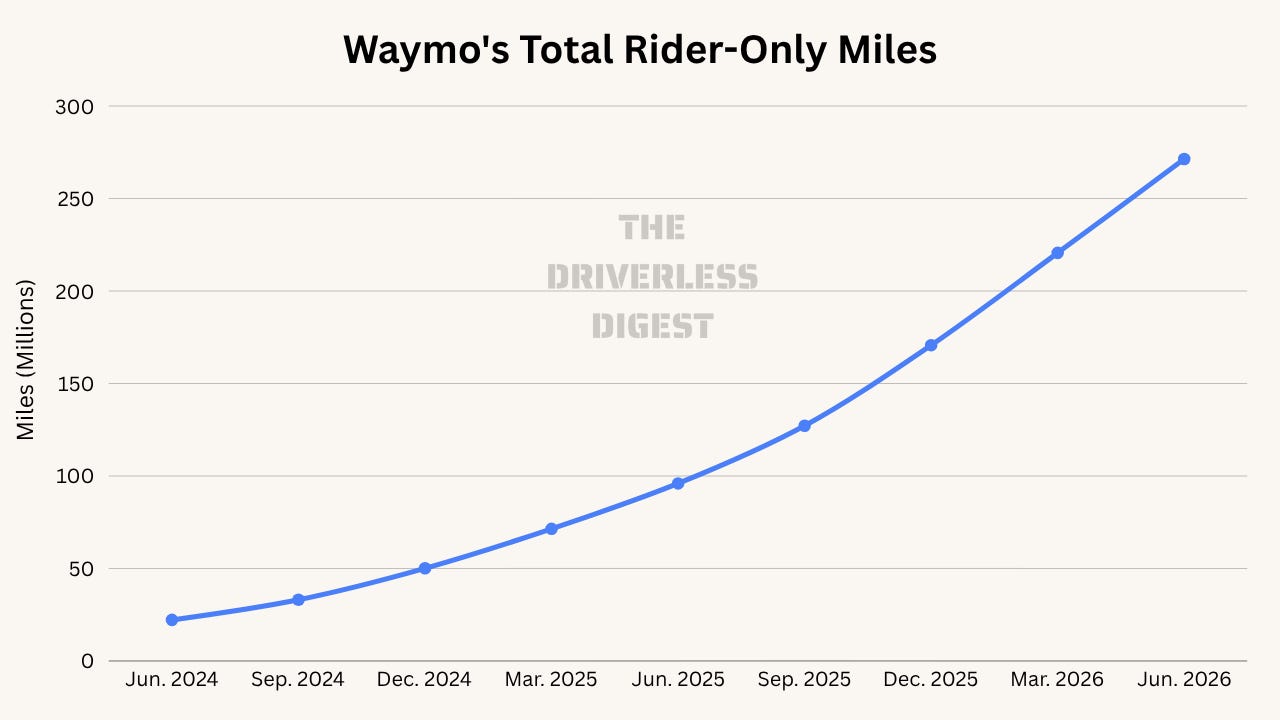
From the chart above, we can see that total rider-only miles have scaled to ~271M per quarter, roughly 8x growth since Q3 2024.
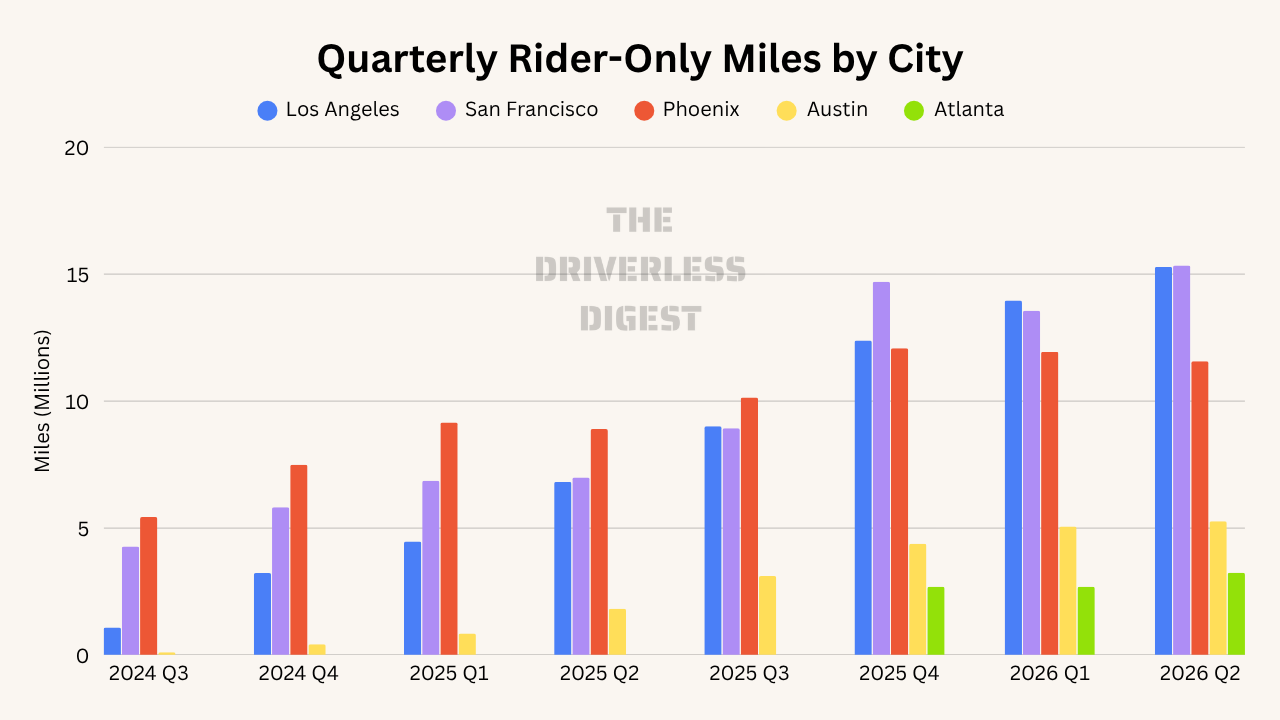
Looking at the data on a quarterly basis below, a few trends stand out: San Francisco and Los Angeles have continued to pull ahead of Phoenix, with both now exceeding 15 million rider-only miles in the latest quarter. Phoenix has started to decline slightly from its recent peak in Q4 2025, while Austin continues to grow steadily. Atlanta remains smaller, but has continued to grow from its initial ramp-up.
Total Rider-Only Miles
On an absolute basis, Phoenix is still in the lead, but Los Angeles and San Francisco continue to catch up.
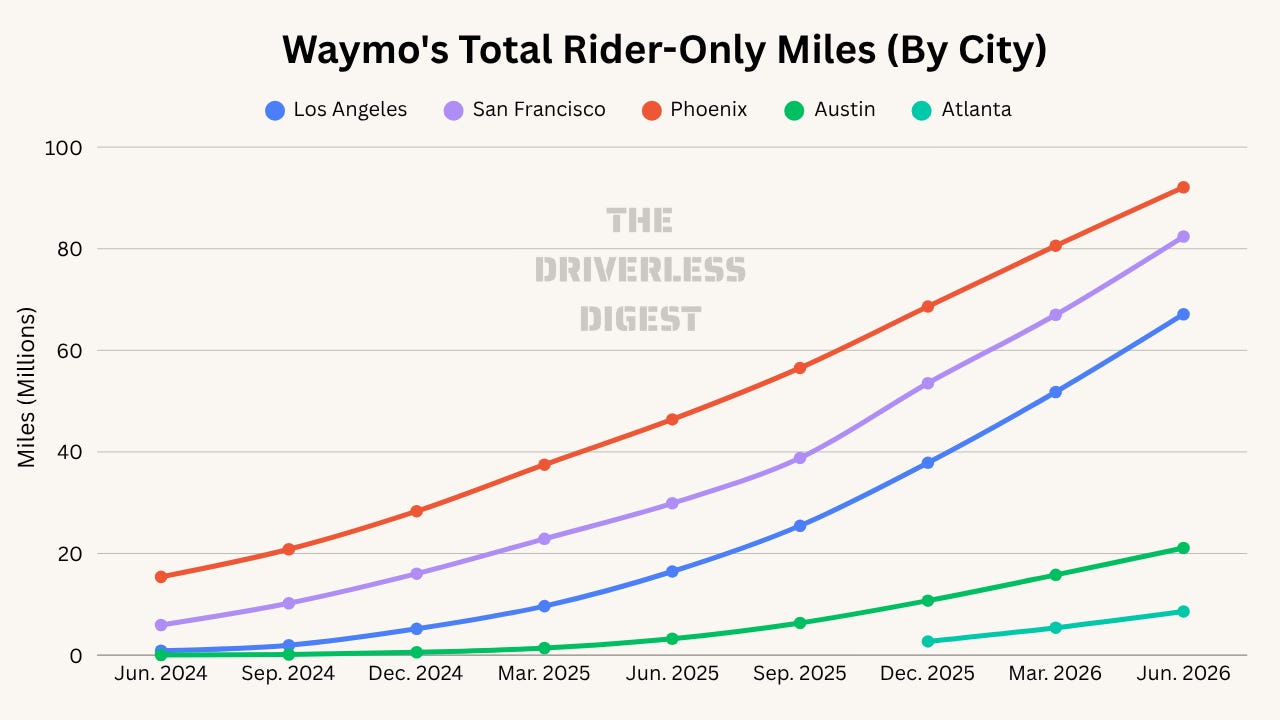
It’s worth noting that all of this data reflects Rider-Only miles, not trips or revenue. Average trip length likely varies by city, so while miles are directionally correlated with usage, they’re not a perfect proxy. Still, the trends here are telling.
City Distribution Over Time
Next, we can look at how each city’s distribution of total RO miles is evolving. This is not market share, but rather each city’s share of Waymo’s overall RO mileage.
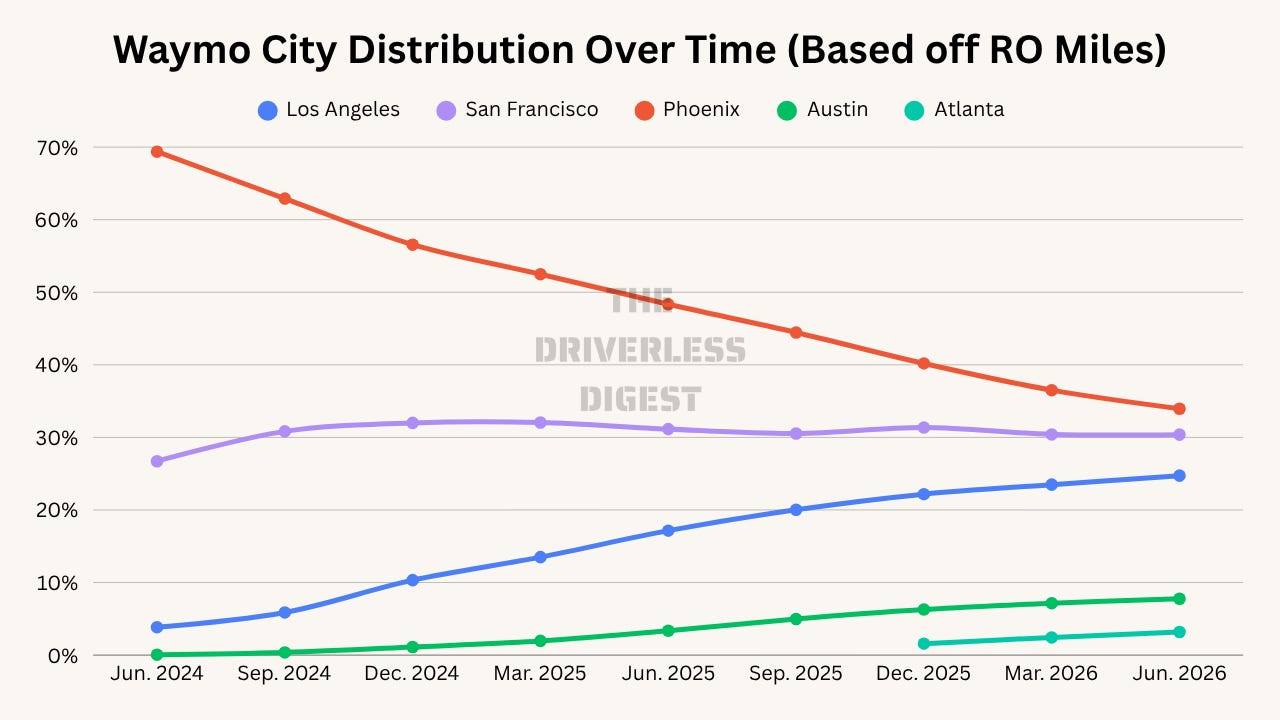
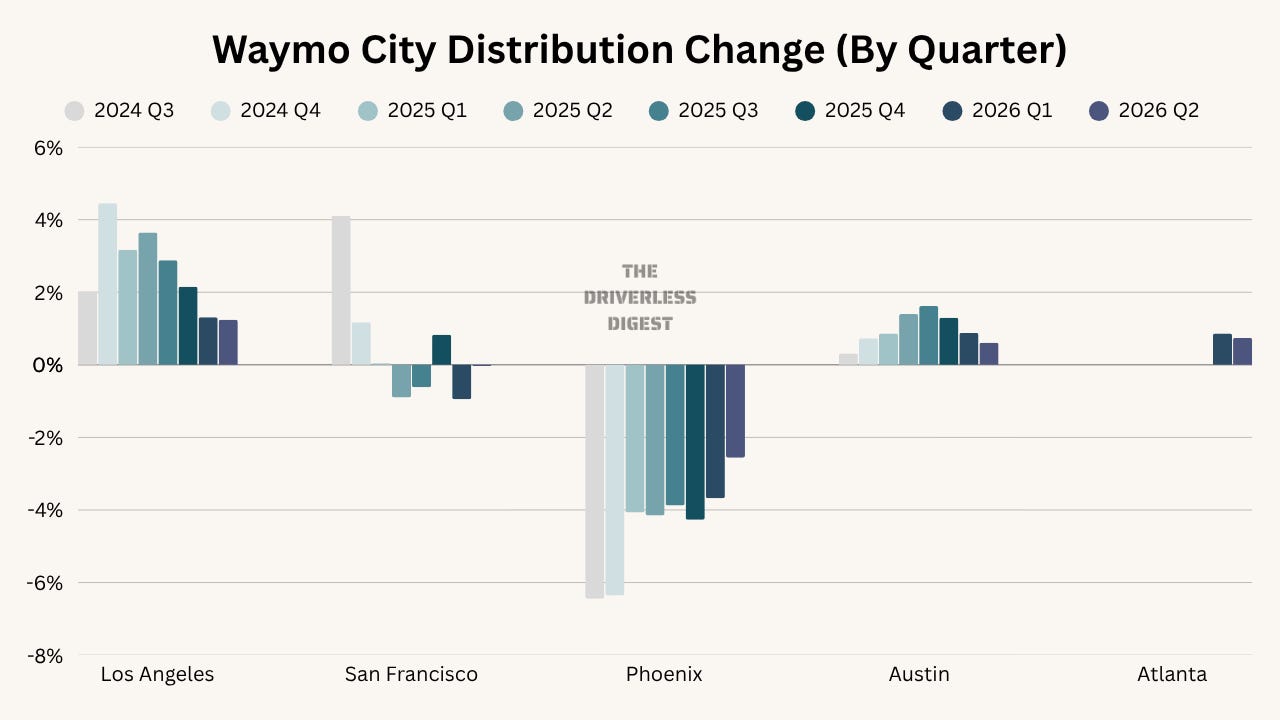
Looking at both total share and quarterly changes, a few things stand out:
Phoenix is still losing share, but the decline slowed in Q2 2026. After several quarters of roughly 4-point losses, its latest decline was closer to 2.5 points.
Los Angeles continues to gain share every quarter, but the pace has slowed. After adding more than 4 points in late 2024, its latest quarterly gain was just over 1 point.
San Francisco has become much more stable. After modest losses through much of 2025 and another decline in Q1 2026, its share was essentially flat in Q2.
Austin is still gaining share, but the pace of growth has slowed noticeably. Its quarterly increase peaked around 1.5 points and has since fallen to roughly half a point.
Atlanta is also still gaining share, but the pace appears to have slowed. Its latest increase was 0.74 points, compared with an estimated average of about 1.2 points per quarter across the prior period4.
It’s too early to draw a direct connection, but the slowdown in Austin and Atlanta is worth watching given that both are Waymo on Uber markets and the partnership appears to be on the outs.
Quarter over Quarter Growth
Finally, quarter over quarter growth has slowed dramatically in 2026. Los Angeles is down to about 9% growth in Q2, San Francisco bounced back to around 13%, and Austin has fallen all the way from triple-digit growth in early 2025 to just 4%. Phoenix is the clearest outlier, with rider-only miles declining for two straight quarters. Atlanta, meanwhile, grew about 20% in Q2, the fastest of any market in the latest quarter.
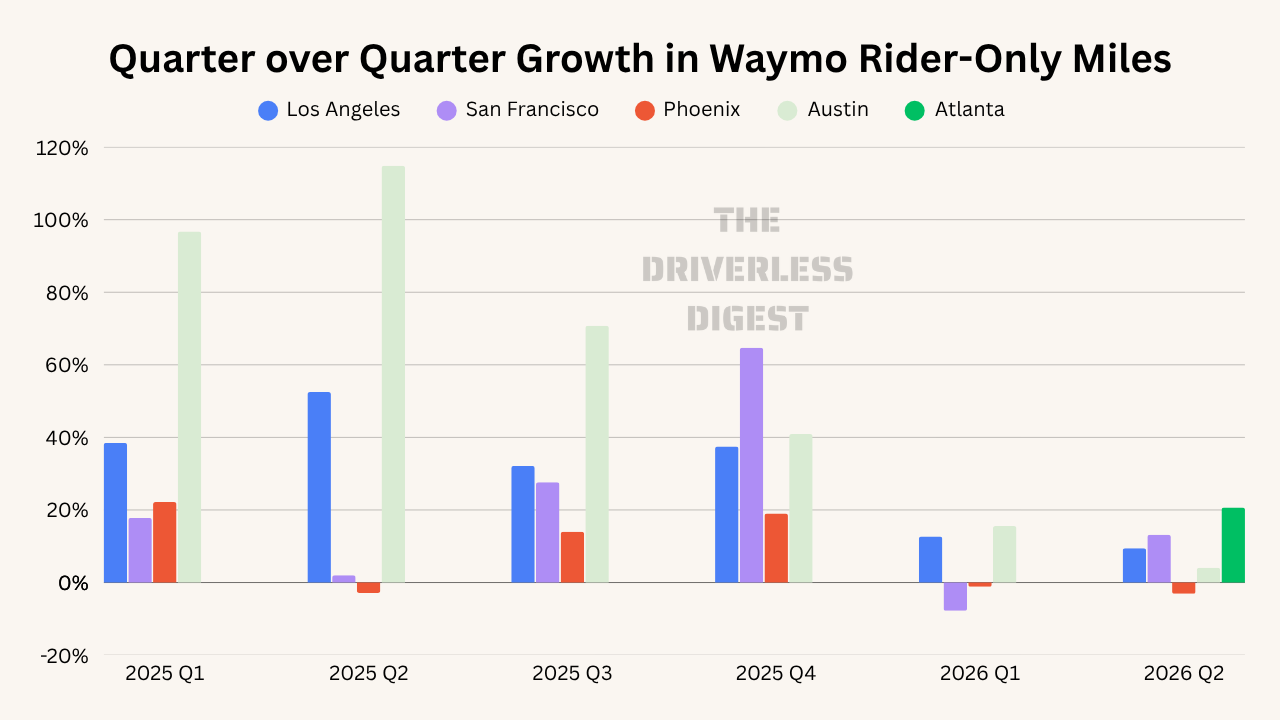
Put together, the data shows Waymo’s center of gravity continuing to shift away from Phoenix. Phoenix still leads in cumulative rider-only miles, but Los Angeles and San Francisco are now generating the most miles each quarter, while Phoenix has declined for two straight quarters. Austin is still adding miles, though growth has slowed considerably. Atlanta is the newest market in the data and grew about 20% quarter over quarter in Q2, though it still represents a relatively small share of Waymo’s total rider-only miles.
-Harry
Miles that Waymo has driven without a human driver.
Waymo says it only shows city-level safety comparisons for markets with sufficient Rider-Only miles for statistical comparisons, so newer markets may not appear immediately. Atlanta, for example, was first added once it had accumulated about 5.4 million Rider-Only miles.
Atlanta’s first reported increase appears as 2.44 percentage points in the chart. Because Waymo-on-Uber had already been operating there for roughly two quarters before Atlanta was broken out separately in Waymo’s rider-only mileage data, we treat that 2.44-point increase as covering roughly two quarters, or about 1.2 points per quarter on average, when comparing growth rates.