
Analyzing Waymo’s City Distribution Using Rider-Only Miles

Every quarter, Waymo updates its Safety Impact page with the latest Rider-Only (RO)1 miles driven across its operating cities: Los Angeles, San Francisco, Phoenix, and Austin2. Here’s the latest snapshot released in March 2026:
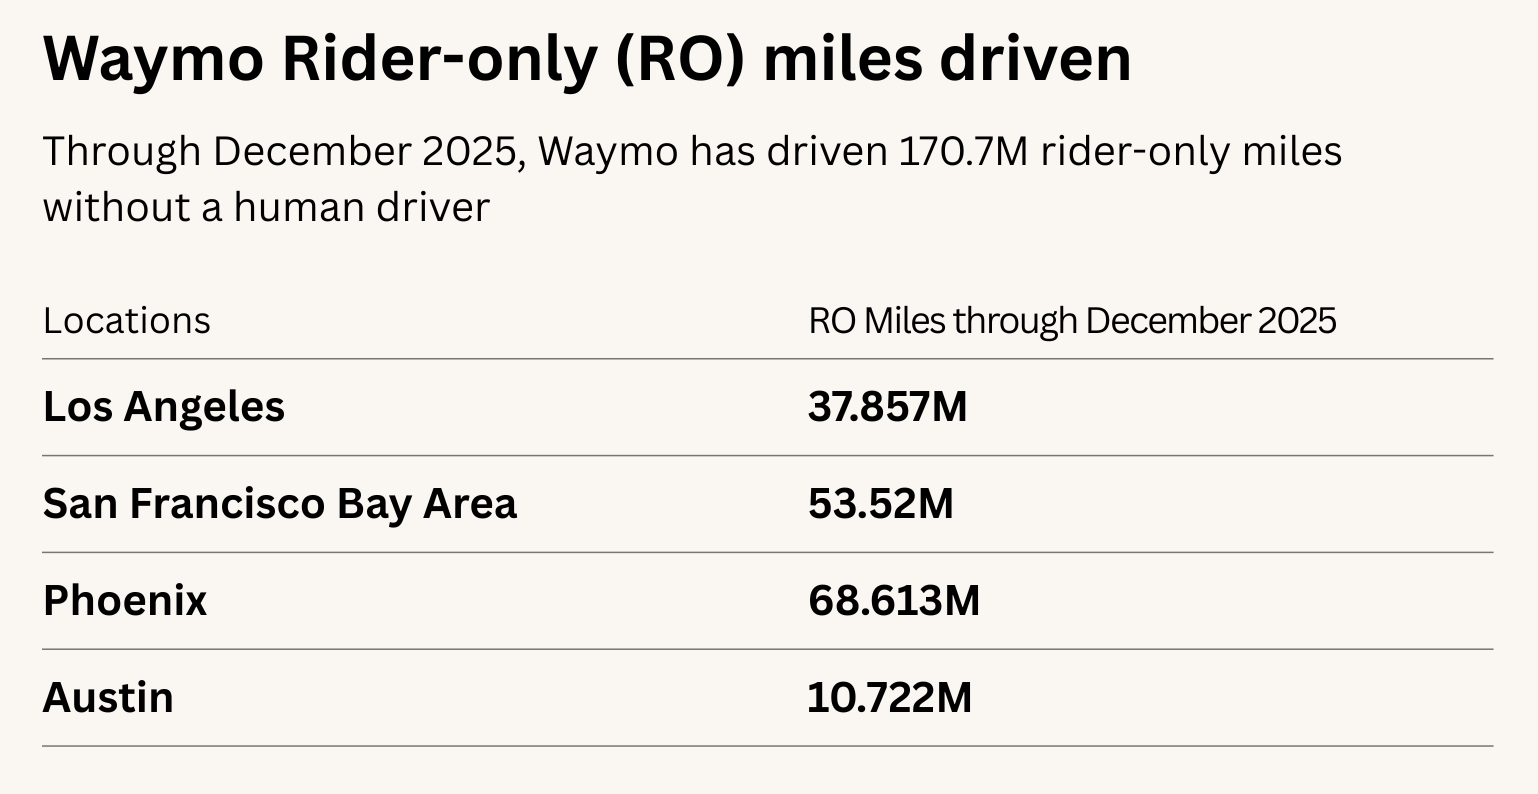
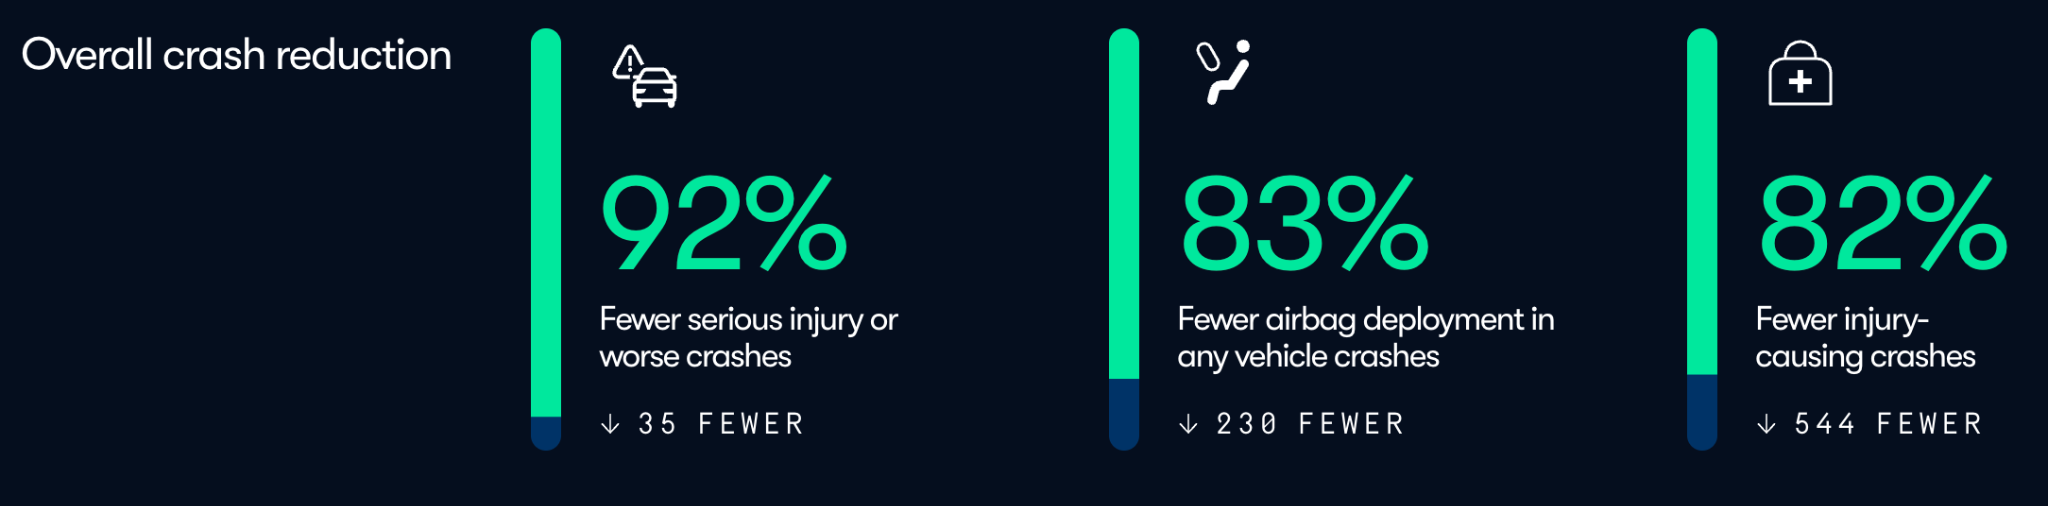
Waymo highlights this data to benchmark its performance against human drivers. And so far, the results have been fantastic. Compared to an average human driver over the same distance in its operating cities, Waymo reports significantly better safety outcomes: 92% fewer serious injury or worse crashes, 83% fewer crashes involving airbag deployment, and 82% fewer injury-causing crashes.
Historical Rider-Only Miles Data
Waymo doesn’t publish historical breakdowns of Rider-Only miles, so to get a better sense of how things are evolving, I’ve been tracking the data by city since mid-20243:
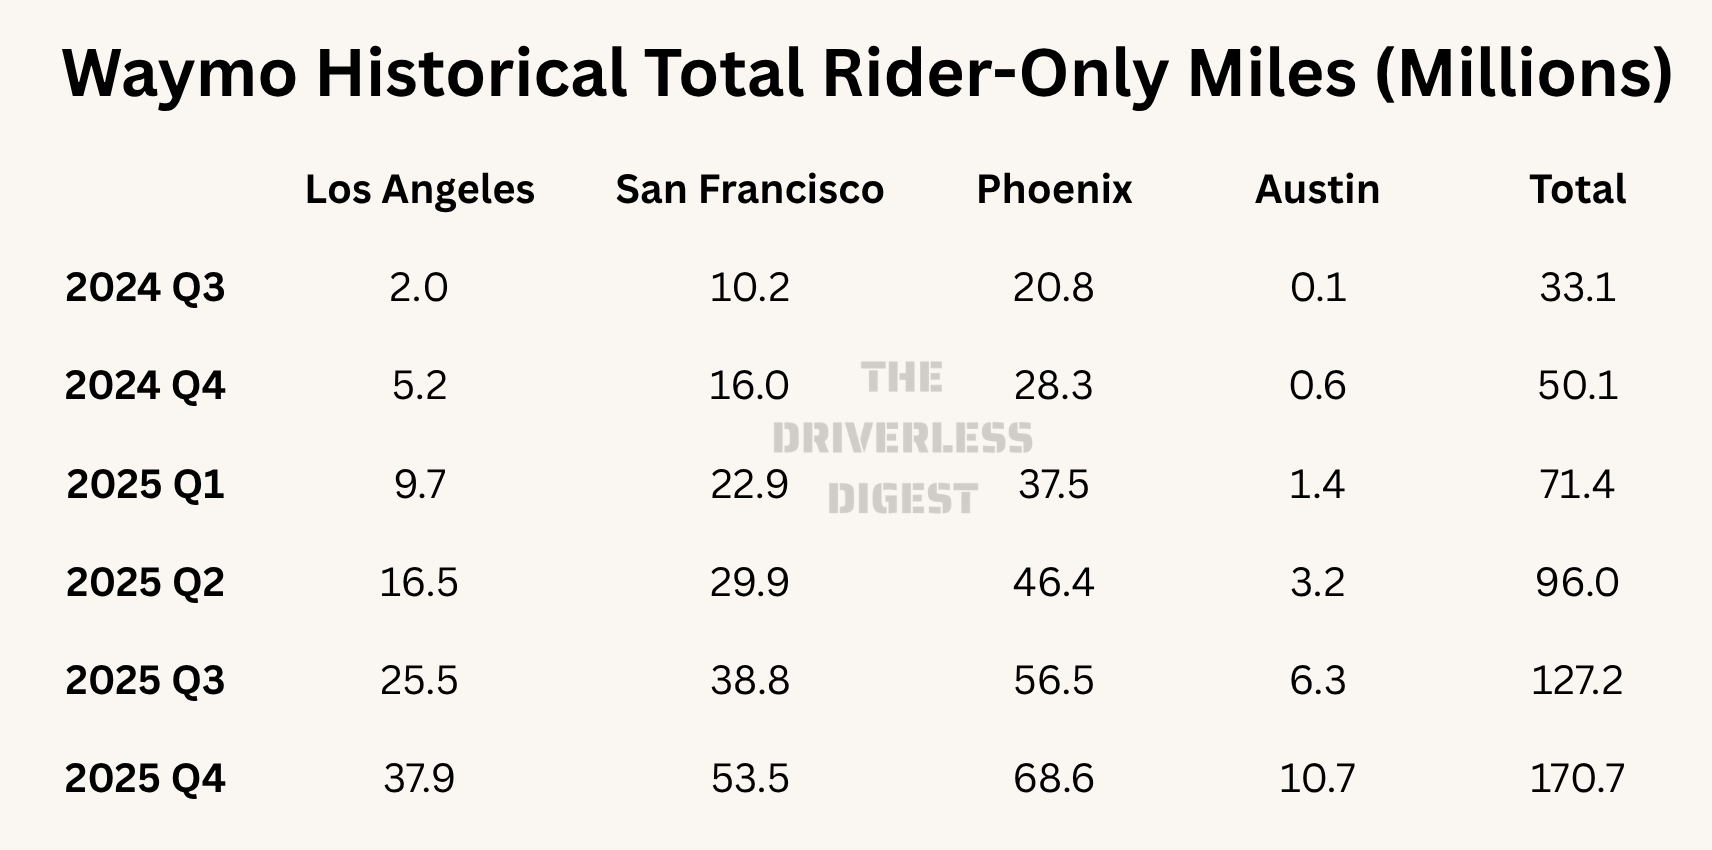
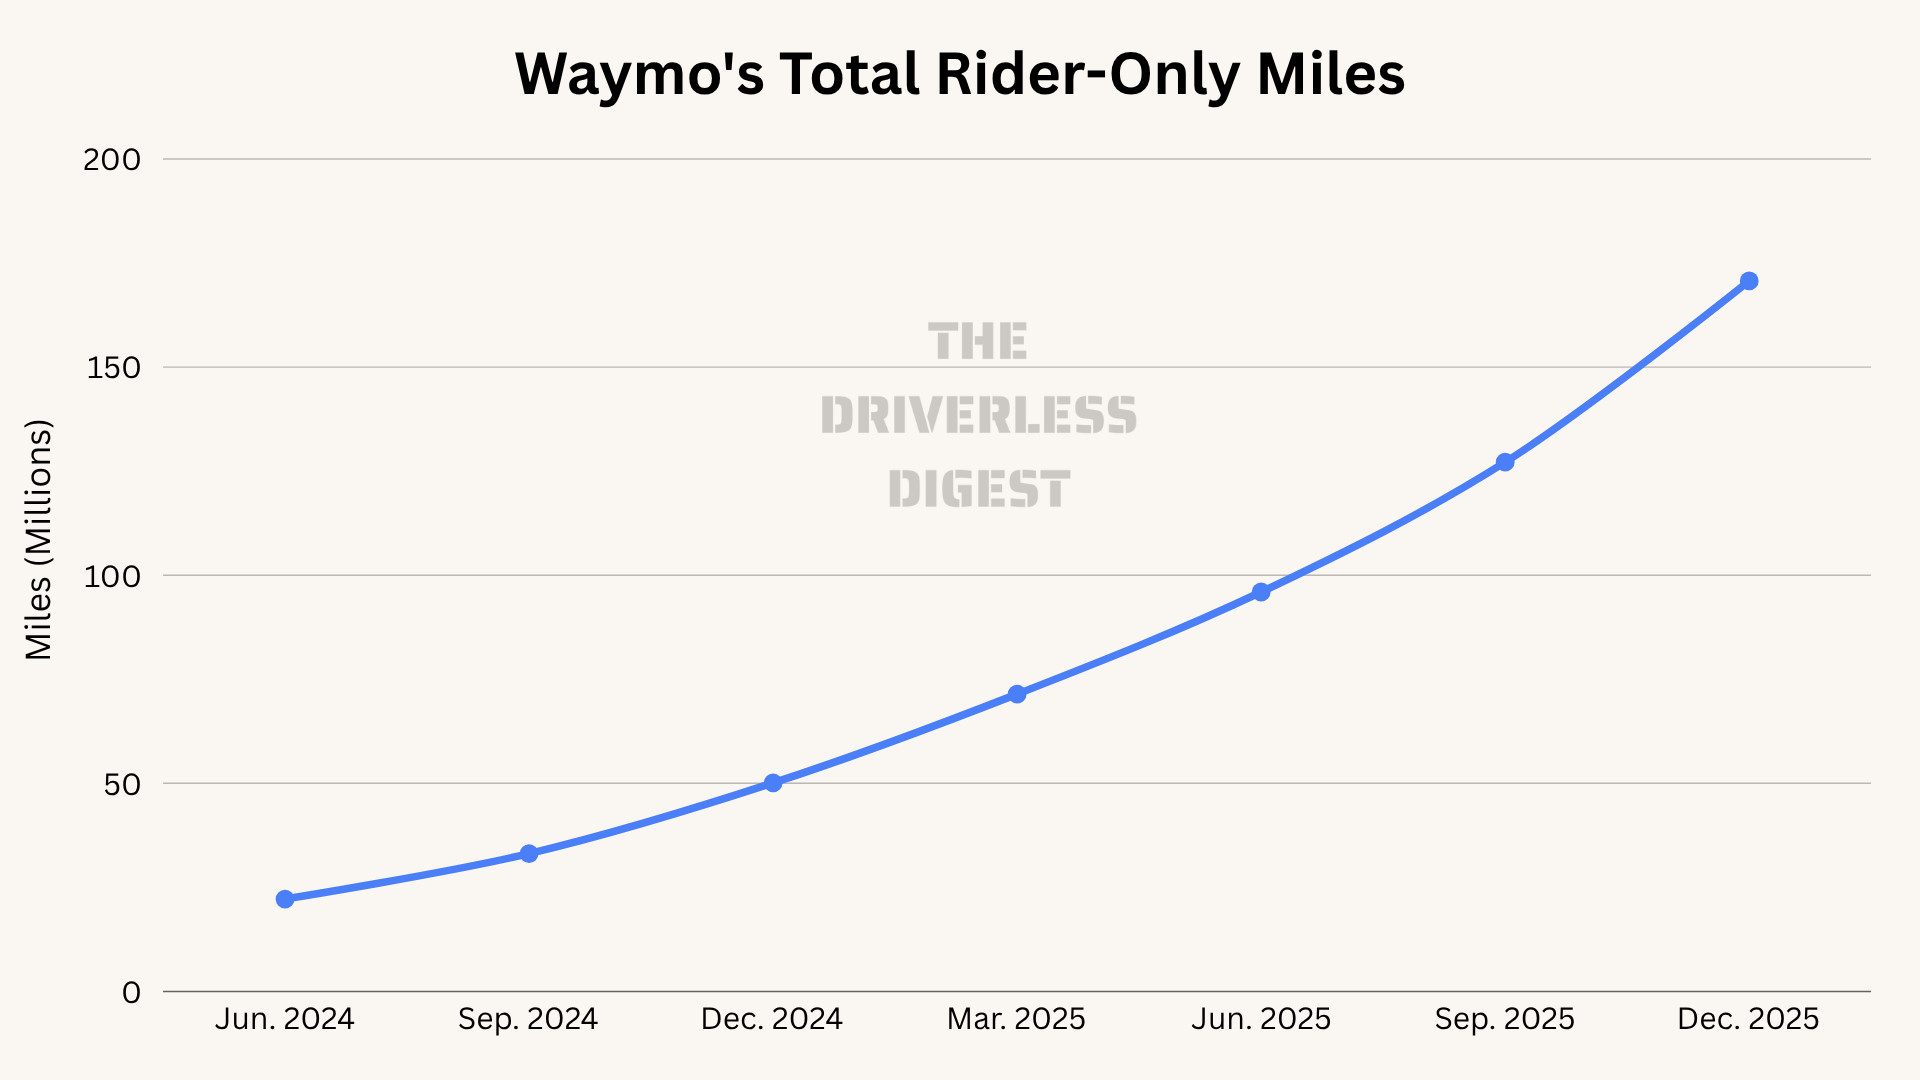
From the chart above, we can see that total rider-only miles have scaled to ~171M per quarter, roughly 5x growth since Q3 2024.
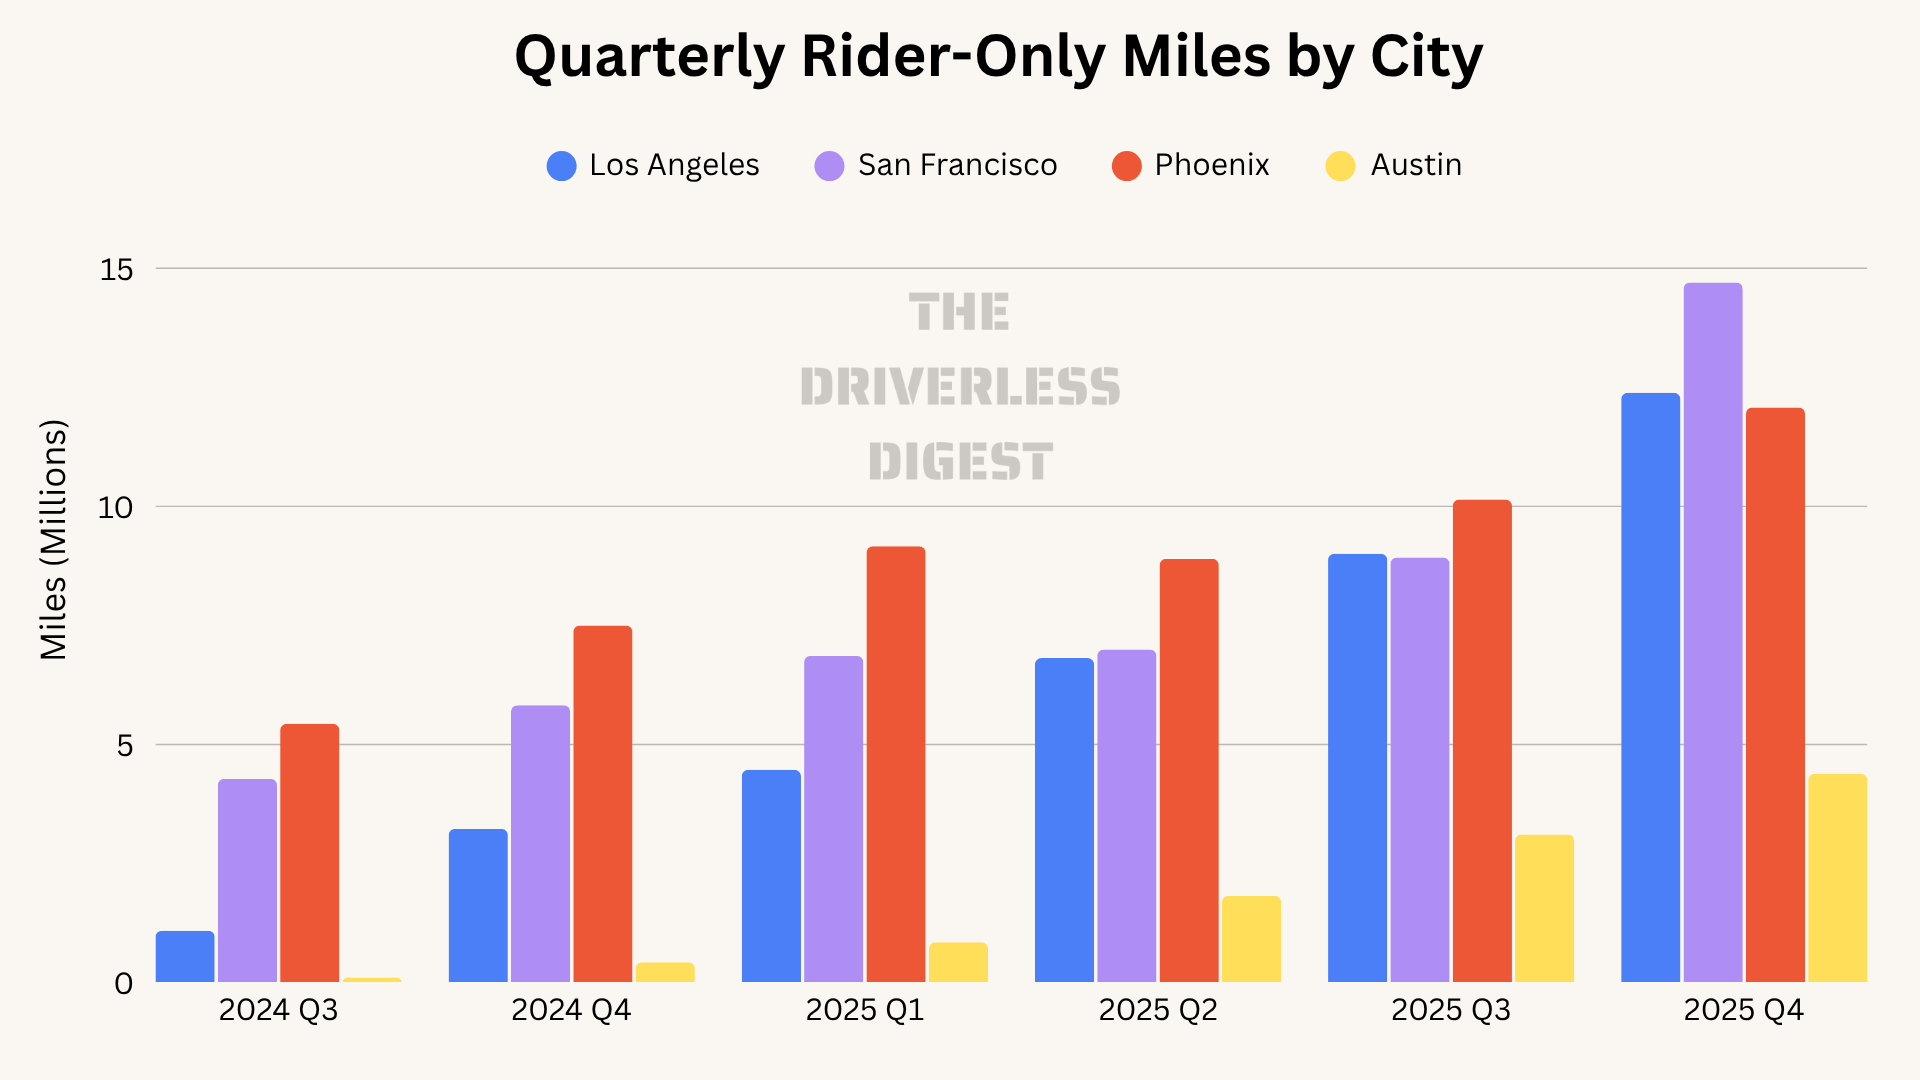
Looking at the data on a quarterly basis below, a few trends stand out: Phoenix continues to grow steadily, while San Francisco and Los Angeles have now caught up and surpassed Phoenix on a quarterly RO miles basis.
Total Rider-Only Miles
On an absolute basis, Phoenix is still in the lead, but Los Angeles and San Francisco are catching up.
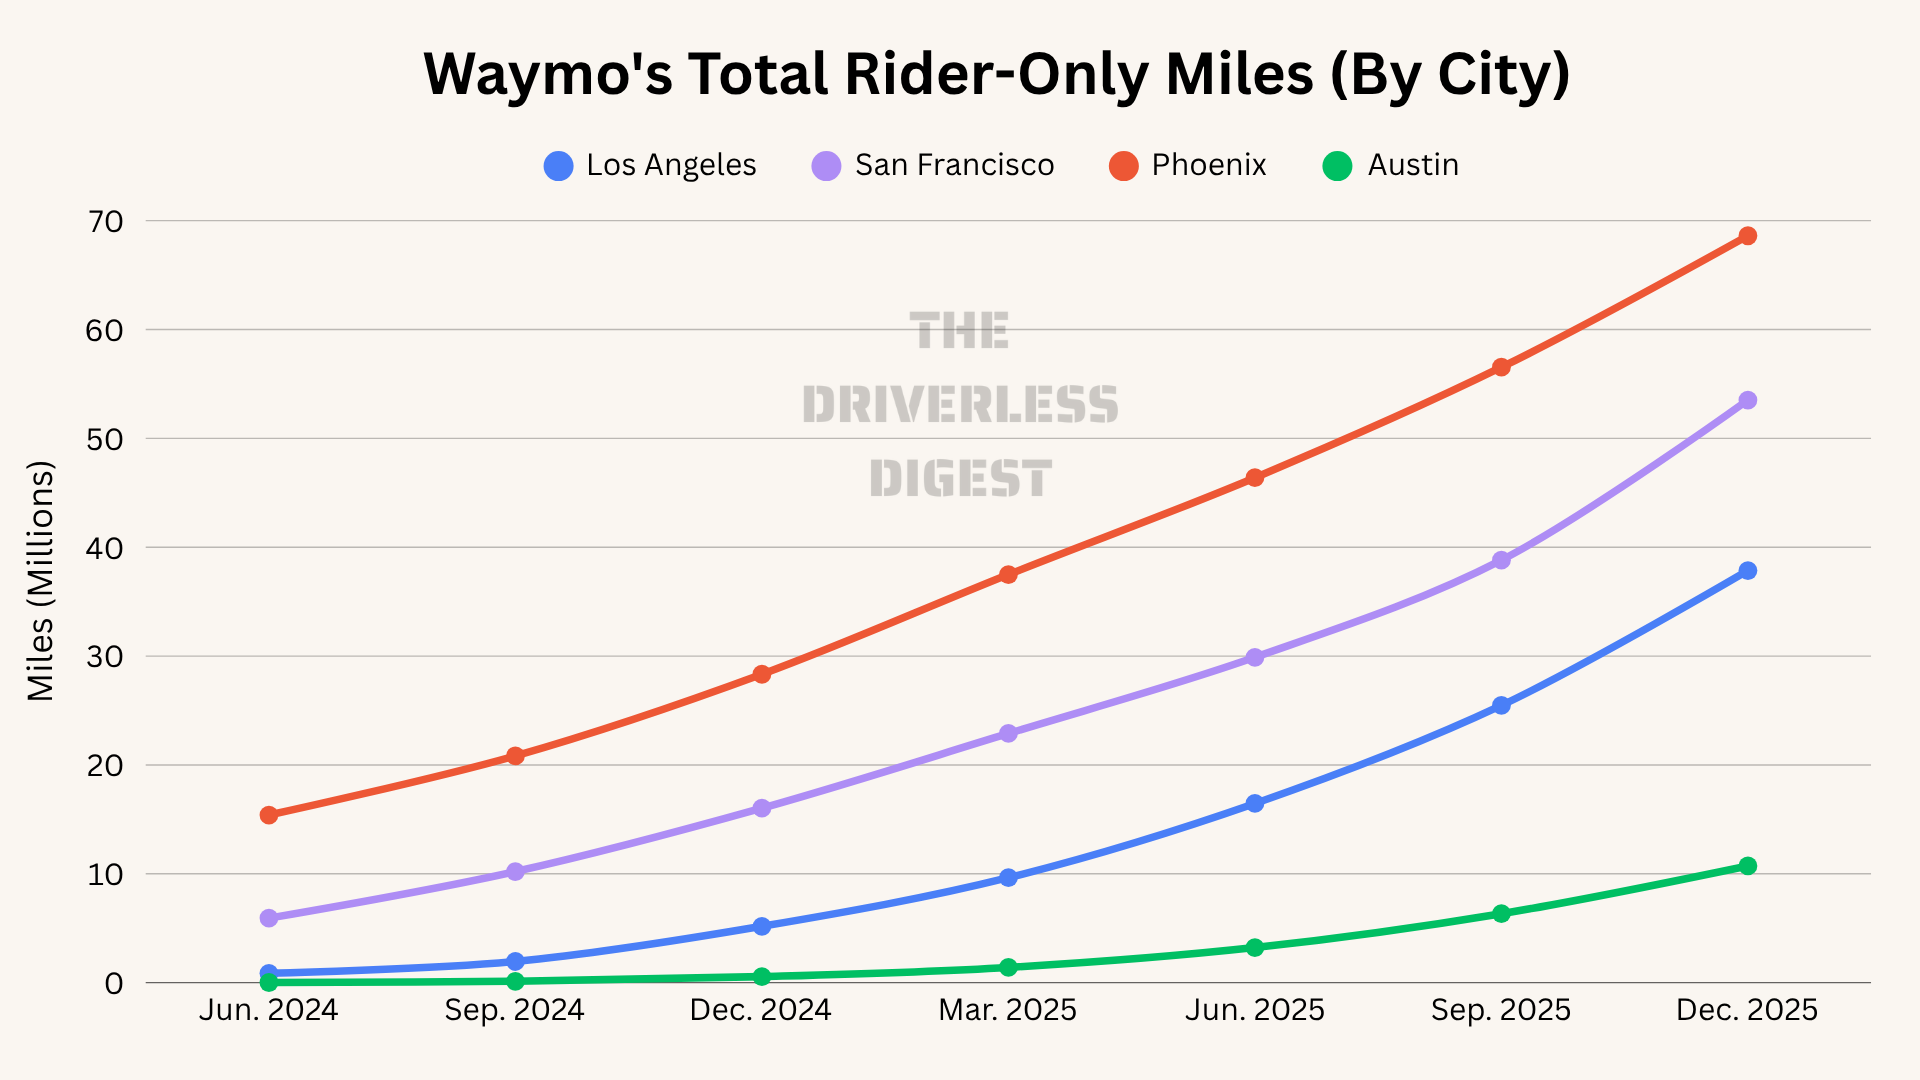
It’s worth noting that all of this data reflects Rider-Only miles, not trips or revenue. Average trip length likely varies by city, so while miles are directionally correlated with usage, they’re not a perfect proxy. Still, the trends here are telling.
City Distribution Over Time
Next, we can look at how each city’s distribution of total RO miles is evolving:
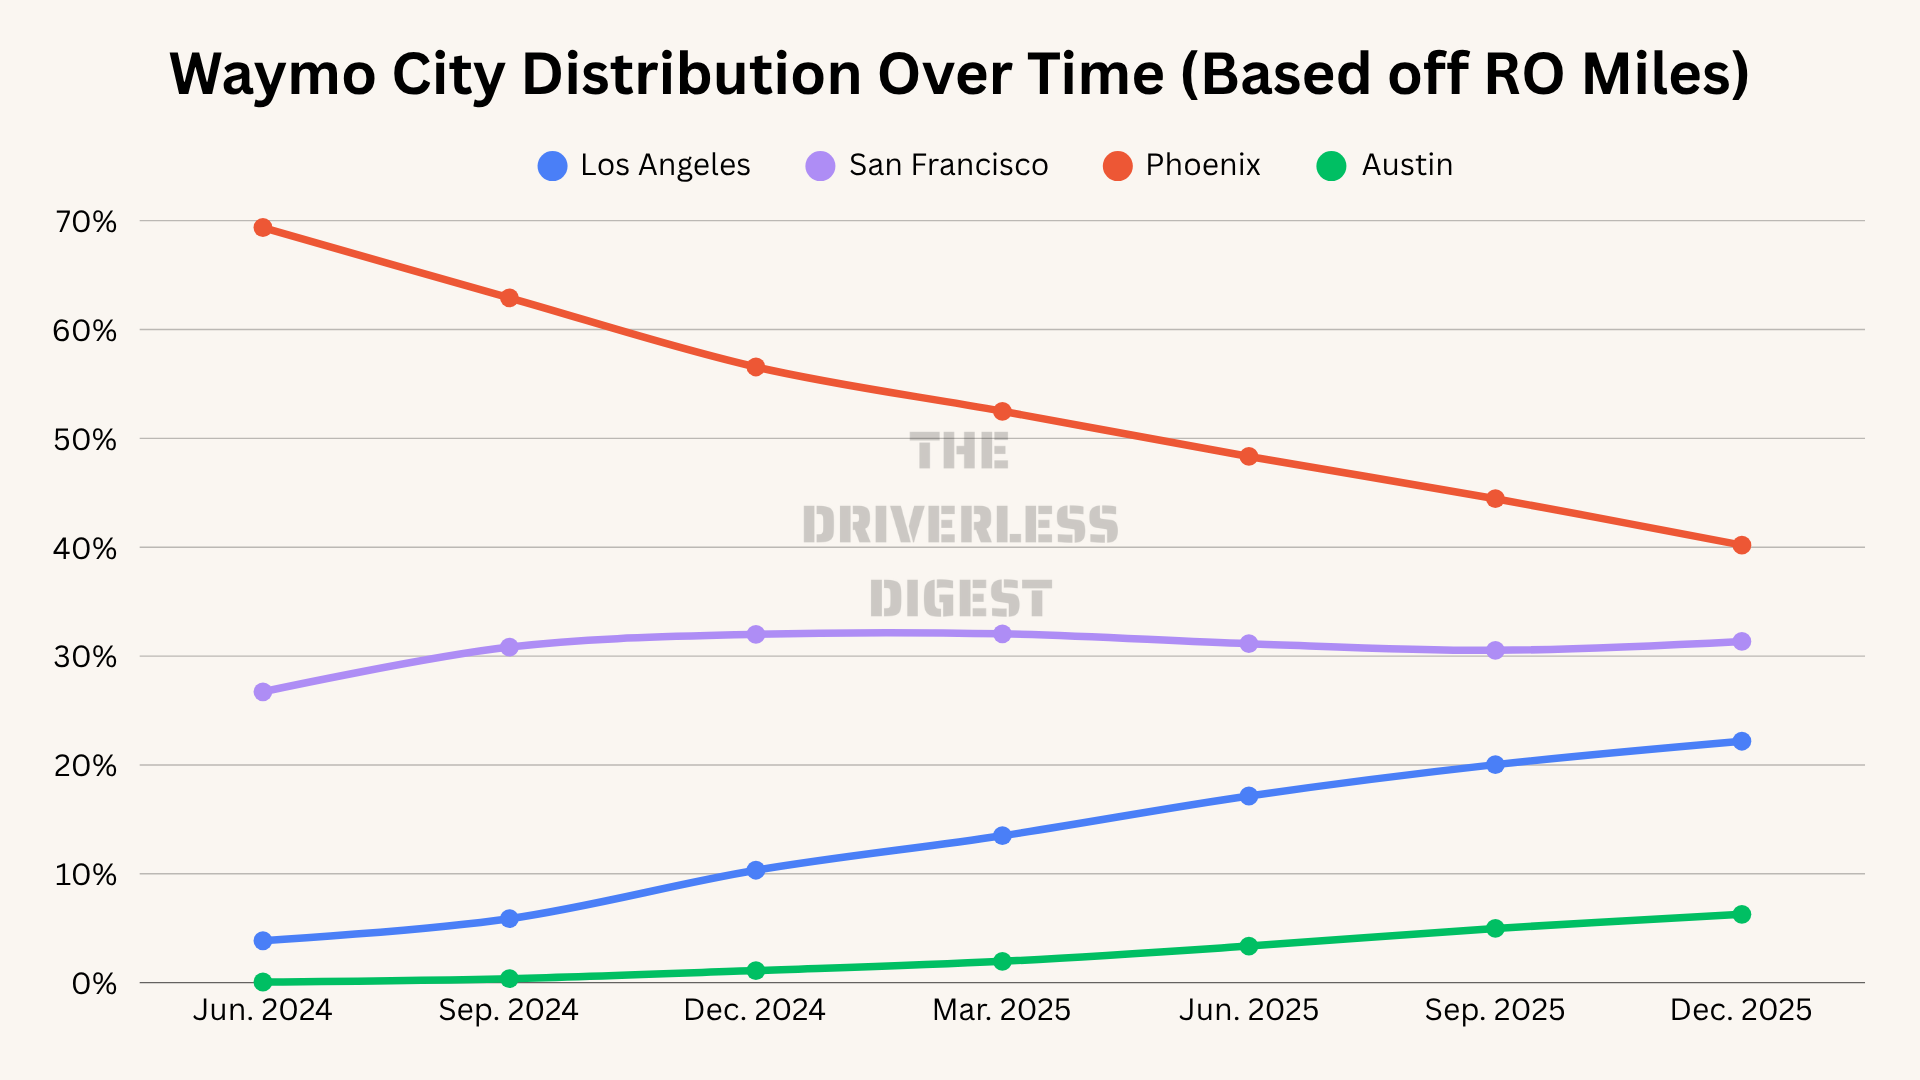
Looking at both total share and quarterly changes, a few things stand out:
Phoenix’s share is declining every quarter, which is the biggest story here and a clear sign that growth is shifting to newer markets.
Los Angeles is steadily gaining share, with consistent quarter-over-quarter increases, although the rate of change appears to be slowing.
San Francisco is mostly flat over the last year, suggesting a more mature, stable market that’s growing but not expanding its relative footprint.
Austin is ramping from a small base, showing steady gains but still early and not yet a major contributor.
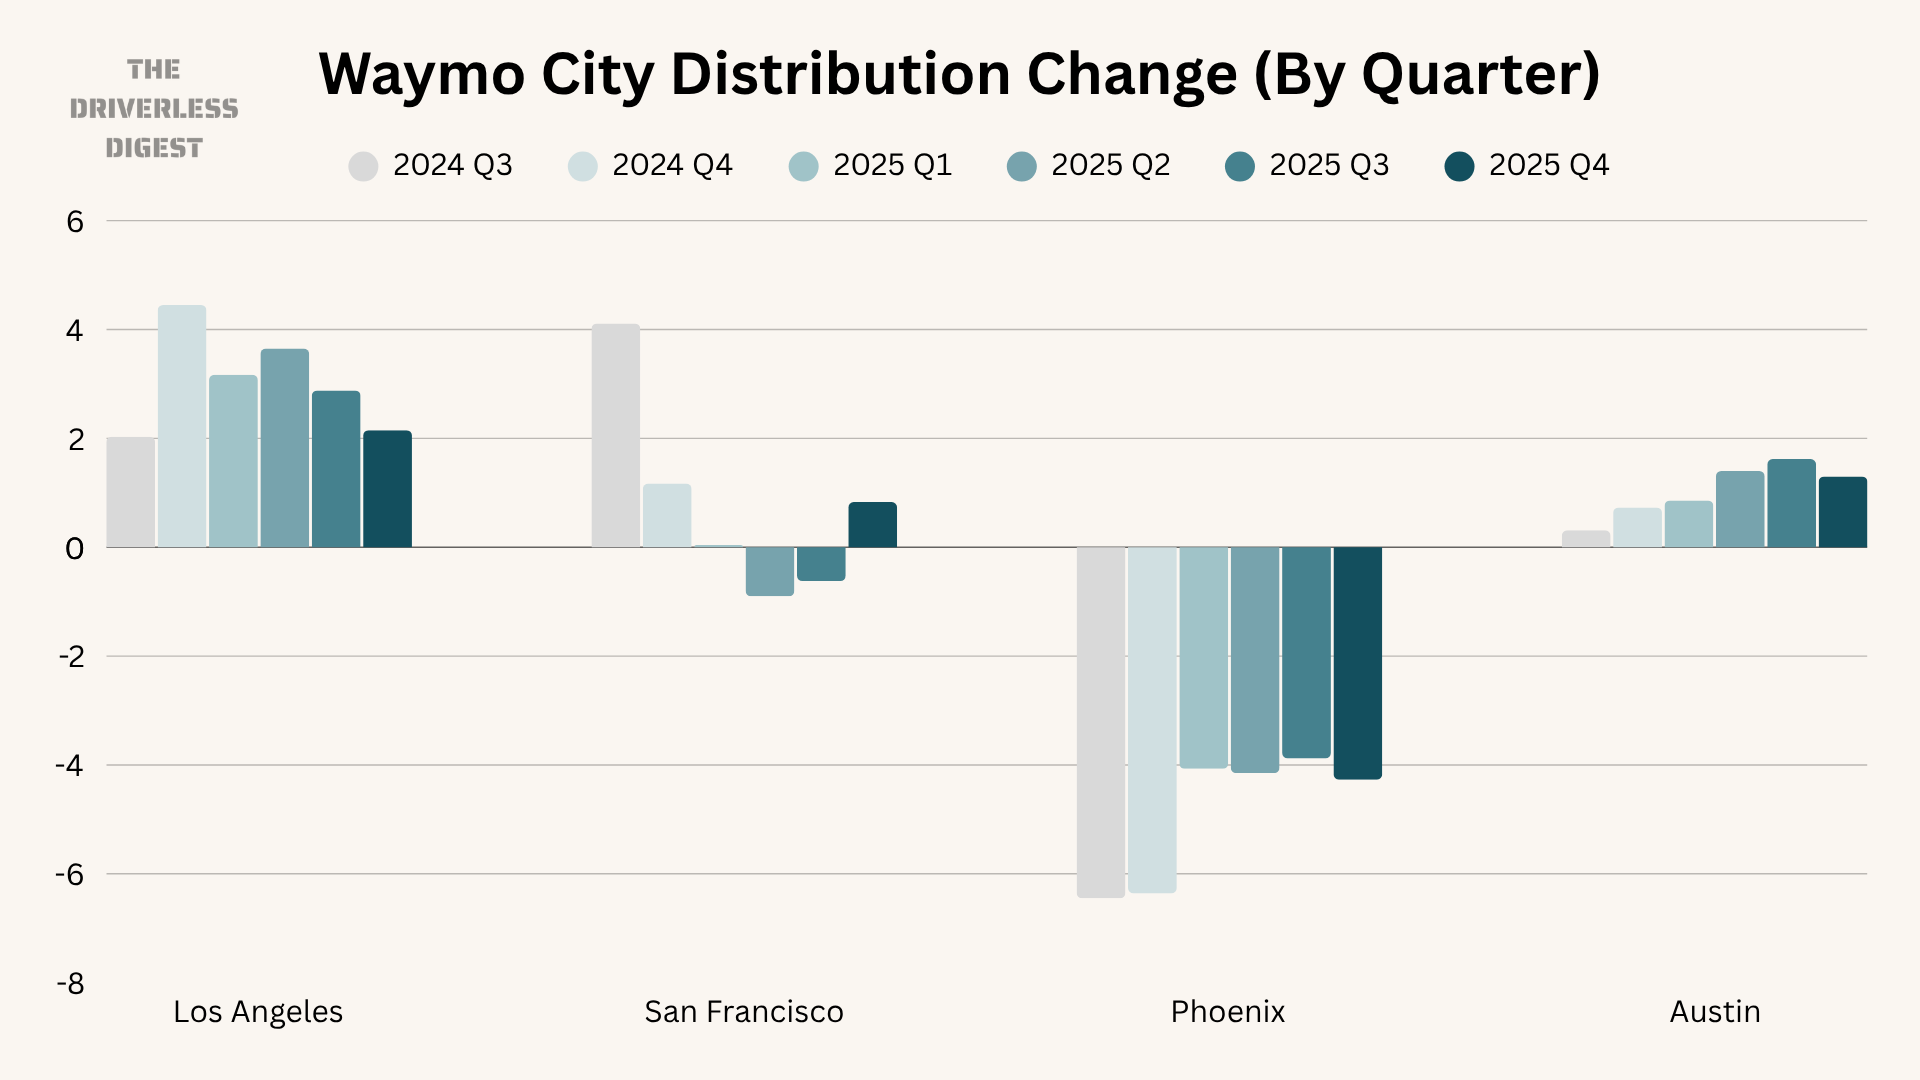
Quarter over Quarter Growth
Finally, when we take a look at quarter over quarter growth, every market has grown almost every single quarter. Austin shows the highest growth rates, but off a small base. Los Angeles is growing quickly and off a much more meaningful base, while San Francisco is more variable but still in a higher-growth phase. Phoenix’s slower growth reflects a more mature, scaled market.
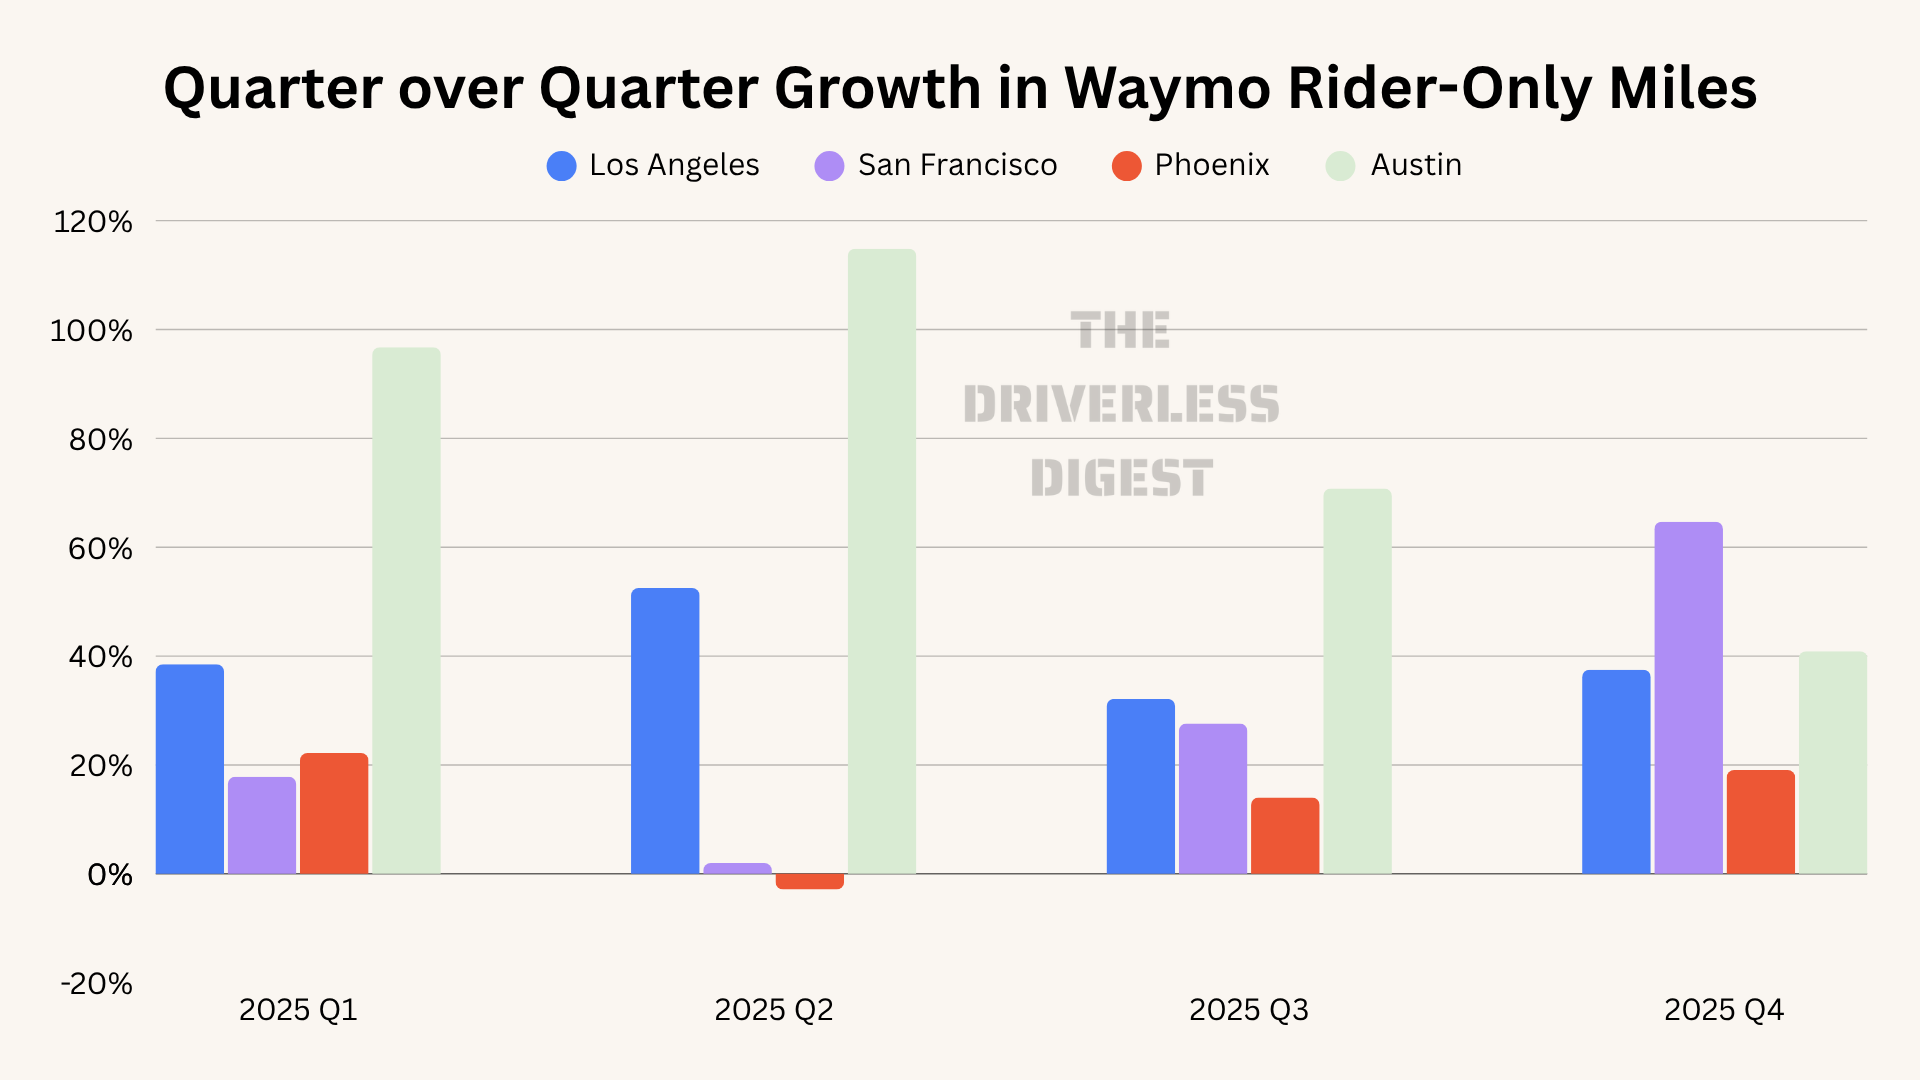
Put together, the data shows a clear shift in where growth is happening. Phoenix still leads in total rider-only miles, but on a quarterly basis, Los Angeles and San Francisco are now generating more new miles. Austin is bringing up the rear, but showing high growth off a small base. It will be interesting to see how these numbers change over time, and as Waymo scales and provides more data on new markets like Atlanta, Nashville and beyond.
-Harry
Miles that Waymo has driven without a human driver.
Waymo does not provide data for Atlanta yet due to limited mileage, which means the results are not yet statistically significant.
Really good analysis. The only thing that caught my atention was the 70% market share of Waymo in PHX in jun 2024. If I get it correct, Waymo had 70% of all ride sharing in PHX? From where are you taking the total miles in every market? Or just an estimate?
Anyways, really helpful.
I wish that other companies would distill their data and be more open in guiding the public on the safety of their program. Some companies instead go as far as to mix and match their miles in places with riders, observers and the occasional rider only miles go into one flaming pile. Those statistics are irrelevant at best and downright deceptive at worst.
One of the coolest takeaways from the safety report is how much effort it takes to get to safety relevant (about 10M rider only miles). Only these four cities got there so far. The biggies are beyond 100K miles a day and Austin closer to 30K per day. This what it takes to reveal as a 'serious' market. In Waymo's world, it would be IRRESPONSIBLE to protect the inherent safety in a market until they get to about 10M miles. It is refreshing to treat statistics responsibly. That is what it takes to draw real safety conclusions based on error bars.
It will be interesting to watch how long before new cities emerge. I am guessing that Miami will be the next big market and maybe DFW and get to 10M miles rather quickly -- maybe as early as 3Q this year so by the EOY safety report. Phoenix, San Francisco & Los Angeles are now past 100K miles per day while Austin trails at 30K/day. I think Miami will get there surprisingly quickly -- airport service is a tell b/c that's a big part of taxi service.
I am glad Zoox is at least providing guidance in RO miles and now is past 2M miles. If they meet their goals for this year they have outlined they will emerge close to 10M between 4Q26 and 2Q27. Still early days but at least they are providing useful guidance. It is intentionally difficult to guess where Tesla is at. I guess they are likely somewhere between 75 miles/day when Elon & Ashok rode in January and maybe approaching 3000 miles/week after 3+ months now. Still only 10a-3p when not raining and MAYBE 3 cars. All of the rest of the 'meaningful miles' are silly and irrelevant. Providing real RO miles is hard. It is a great shortcut to identify the shill. That's 3000 miles a week in a good week I would guess. Irresponsible to even guess how long to get 10M miles of experience in Austin in even a modest ODD. Time will tell.