

We covered Gridwise Analytics’ last AV Impact Report back in March, when the data pointed to fewer trips per hour for rideshare drivers in cities with robotaxi operations, along with lower earnings in some markets.
Now, Gridwise, an app that helps rideshare and delivery drivers track their trips and earnings, is back with its Q2 2026 AV Impact Report, examining how rideshare activity has changed across five cities where robotaxis operate. Covering Q1 2024 through Q2 2026, the report offers a longer-term look at how the economics of human-driven rideshare are evolving as autonomous vehicles expand.
The headline finding? Uber and Lyft are taking a smaller cut of each ride in cities where robotaxis operate, meaning they’re earning less per trip in platform fees, even as human drivers complete fewer trips per hour.
Autonomous Ride-Hail Is Spreading Fast
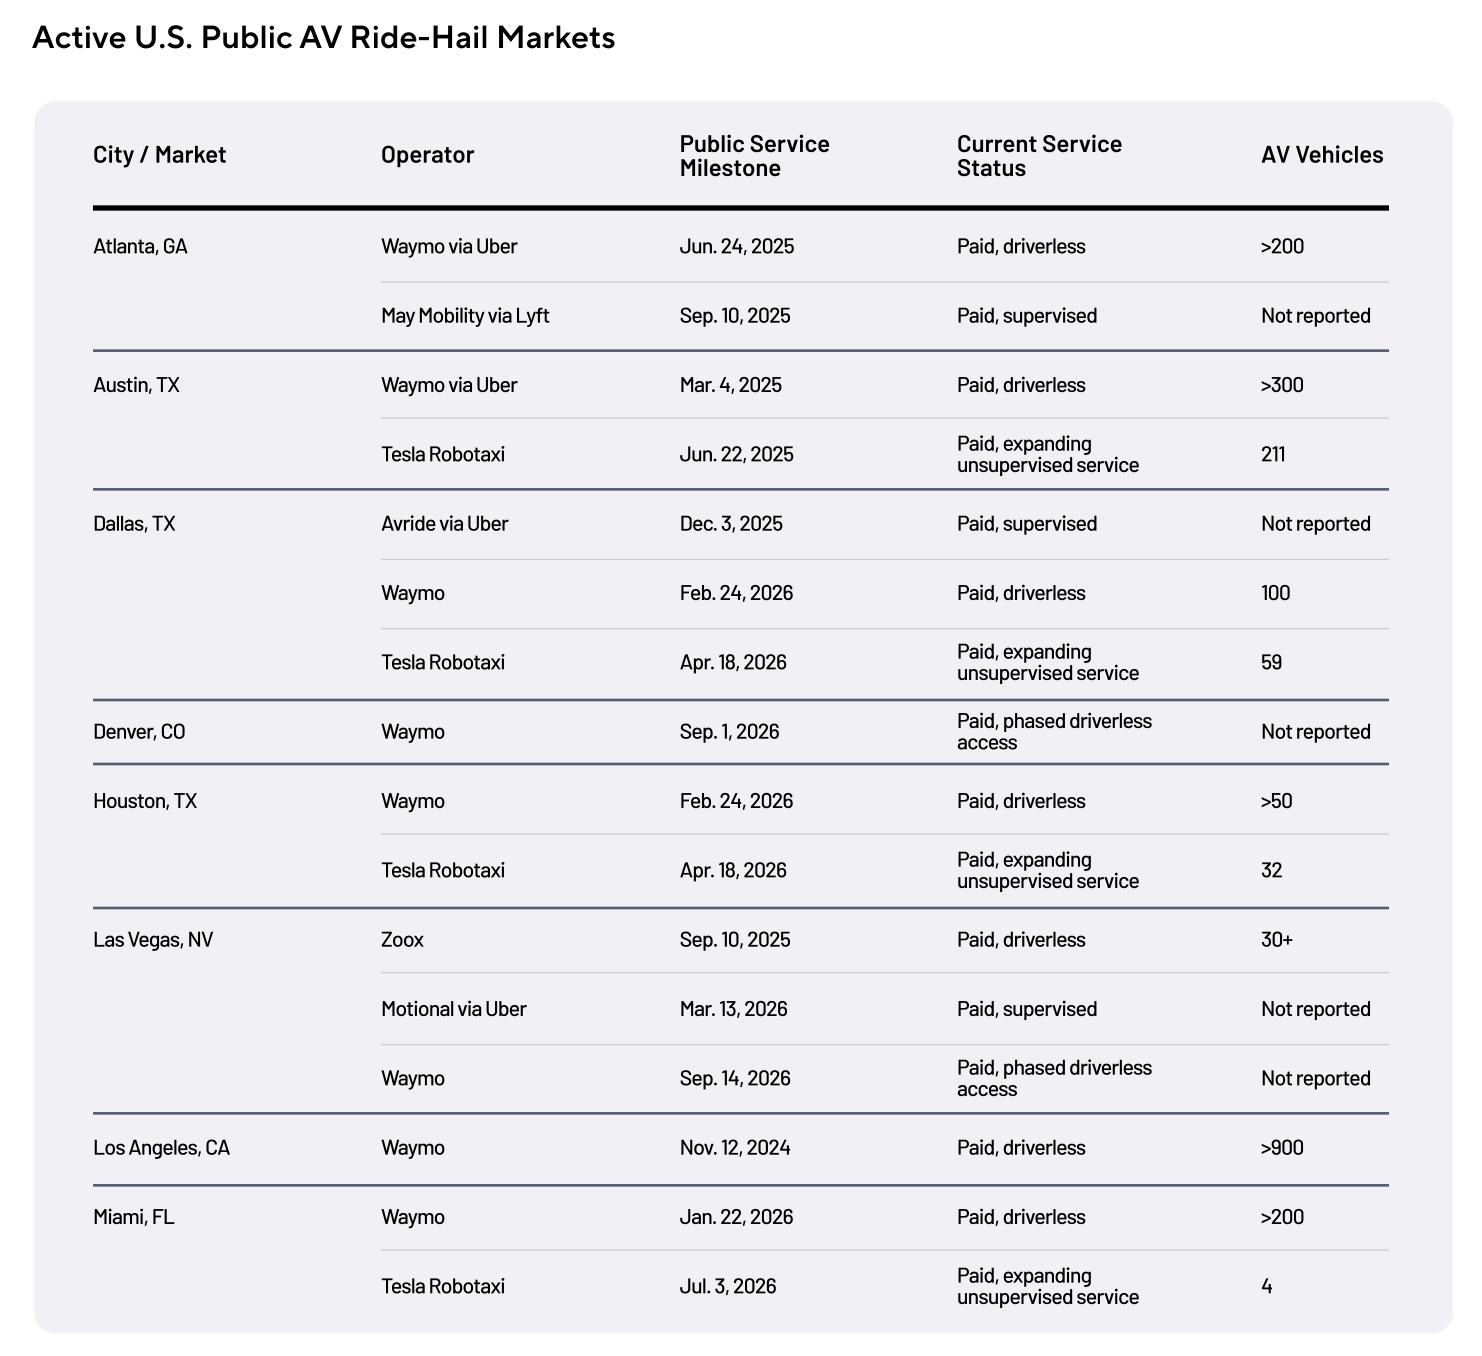
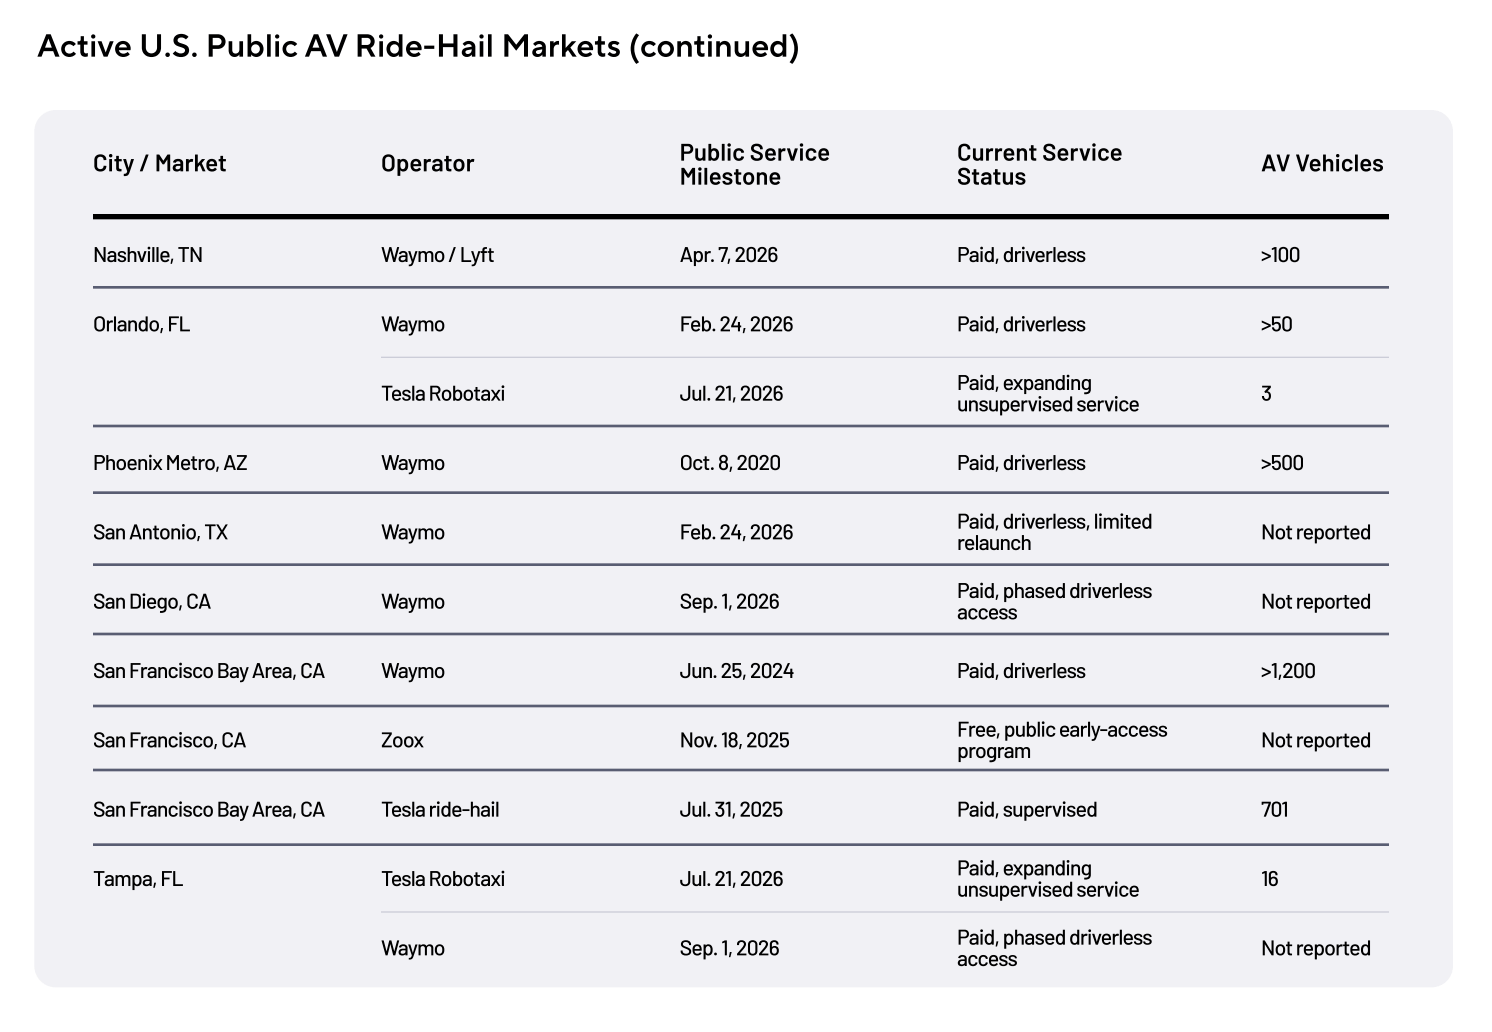
As of September 30, 2026, the U.S. had 27 AV ride-hail services offering public access across 15 metro markets, with more launches announced for 2027.
As AVs grow, so does the question for human drivers who rely on Uber and Lyft: what happens to their activity and earnings?
Gridwise looks at five AV cities: Atlanta, Austin, Los Angeles, Phoenix, and San Francisco, and compares them with nationwide data that excludes AV cities. It uses anonymized data from Uber and Lyft drivers on its app.
The service models range from paid driverless operations to supervised or phased public access, with several markets now having more than one AV operator.
What’s Coming Next
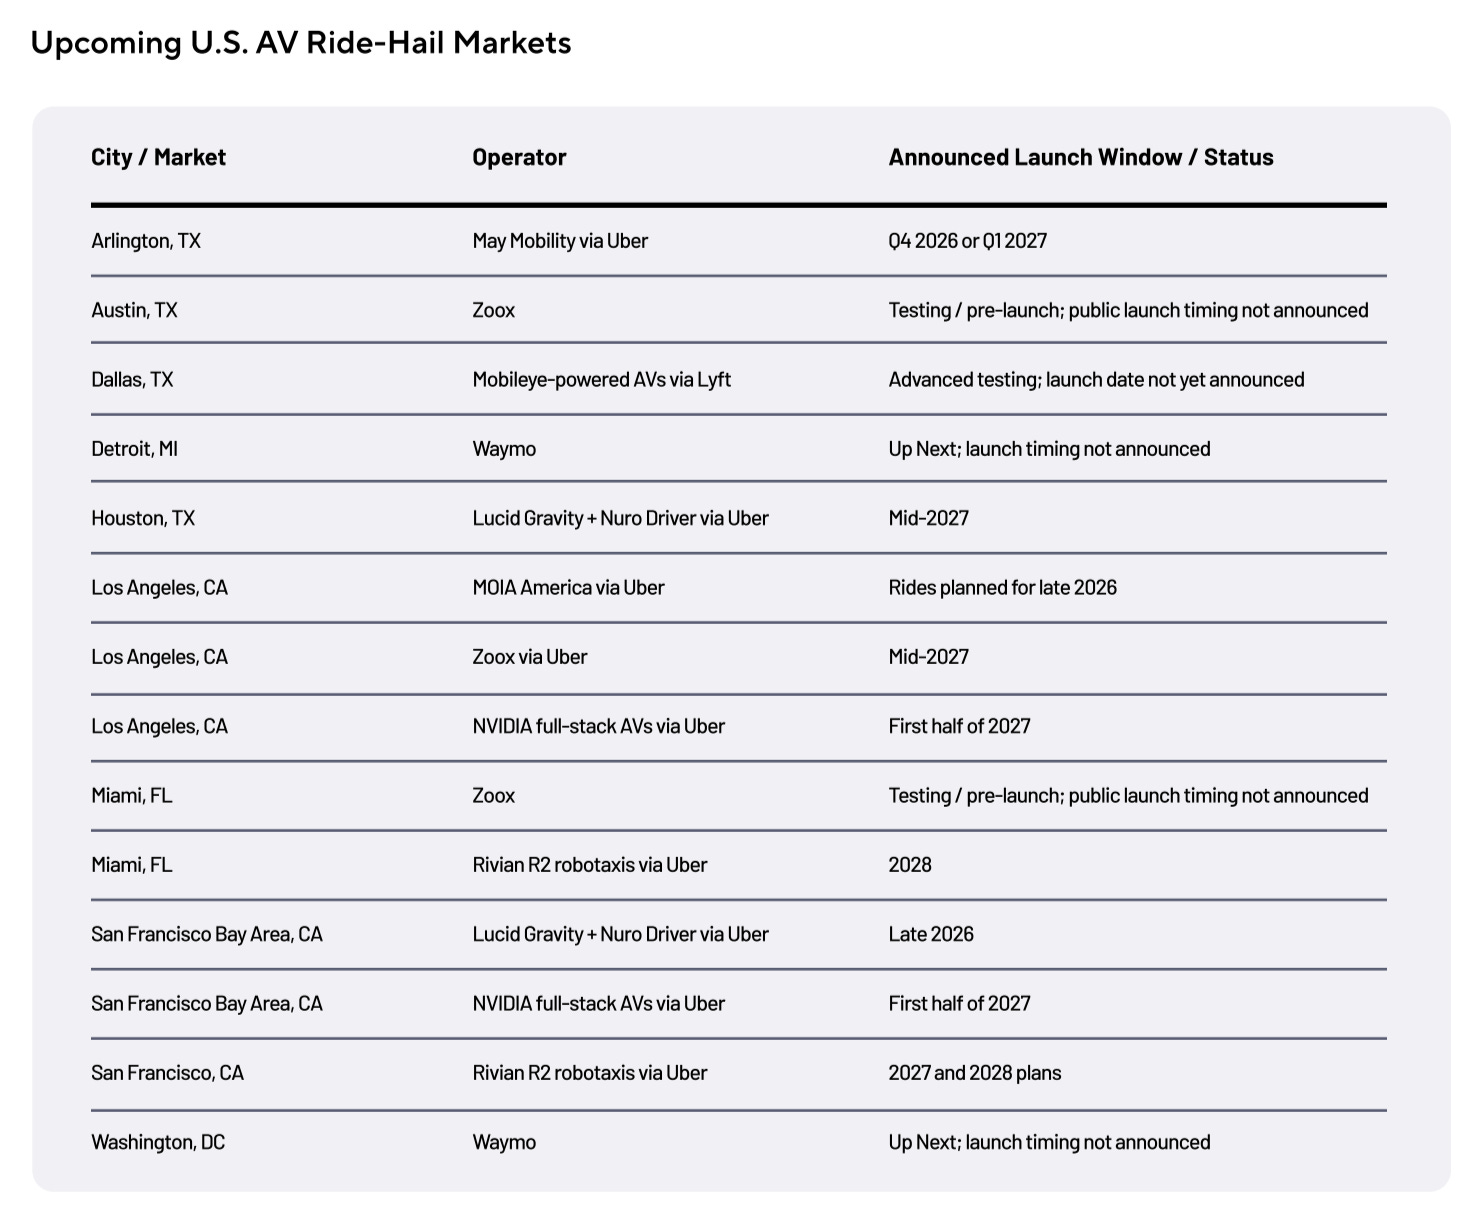
AV expansion is expected to continue through 2027 and beyond, including in cities that already have an AV service from other companies. Gridwise has summarised these deployments that have not yet reached broad public commercial service.
Uber and Lyft Are Keeping Less of Each Fare in AV Cities
This is perhaps the most interesting finding in the report. In cities where robotaxis operate, Uber and Lyft are taking a smaller cut of each ride and earning less in platform fees per trip, while the opposite is happening nationwide.
From Q2 2024 to Q2 2026, the median platform fee per trip fell 13.8% across the five AV cities combined, from $2.61 to $2.25. Nationwide, excluding AV cities, that fee increased 19.2%, from $2.97 to $3.54.
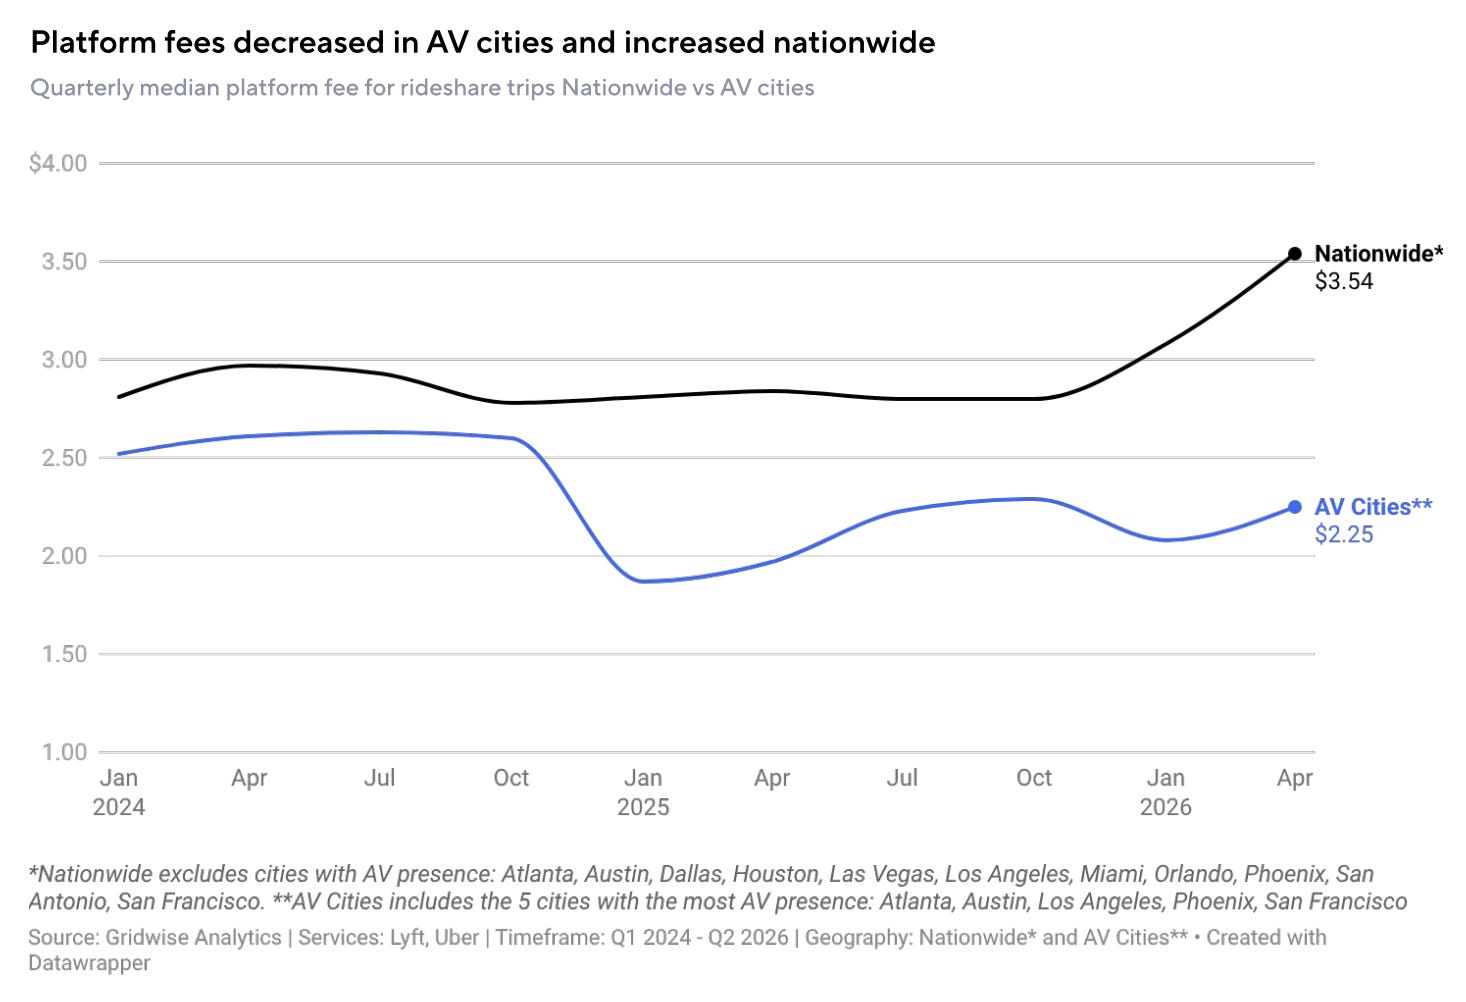
Two years ago, platforms retained a median of $0.36 less per trip in AV cities than elsewhere. By Q2 2026, that gap had widened to $1.29.
Both the dollar amount and the share moved the same way. In the AV cities, Uber and Lyft kept less per trip and a smaller share of each fare, with the median fee rate falling 17.6%. Nationwide, both went up, and the rate rose 6.9%.
Why does this matter? Across the five AV cities combined, Uber and Lyft are keeping less of each ride. This could be an early sign that competition from robotaxis is leading the platforms to take a smaller cut, though Gridwise says the data can’t prove that. It’s potentially good news for drivers, and for riders too if lower fees eventually show up in prices, though we haven’t seen meaningful declines in fares just yet.
Drilling Down On The Five AV Cities
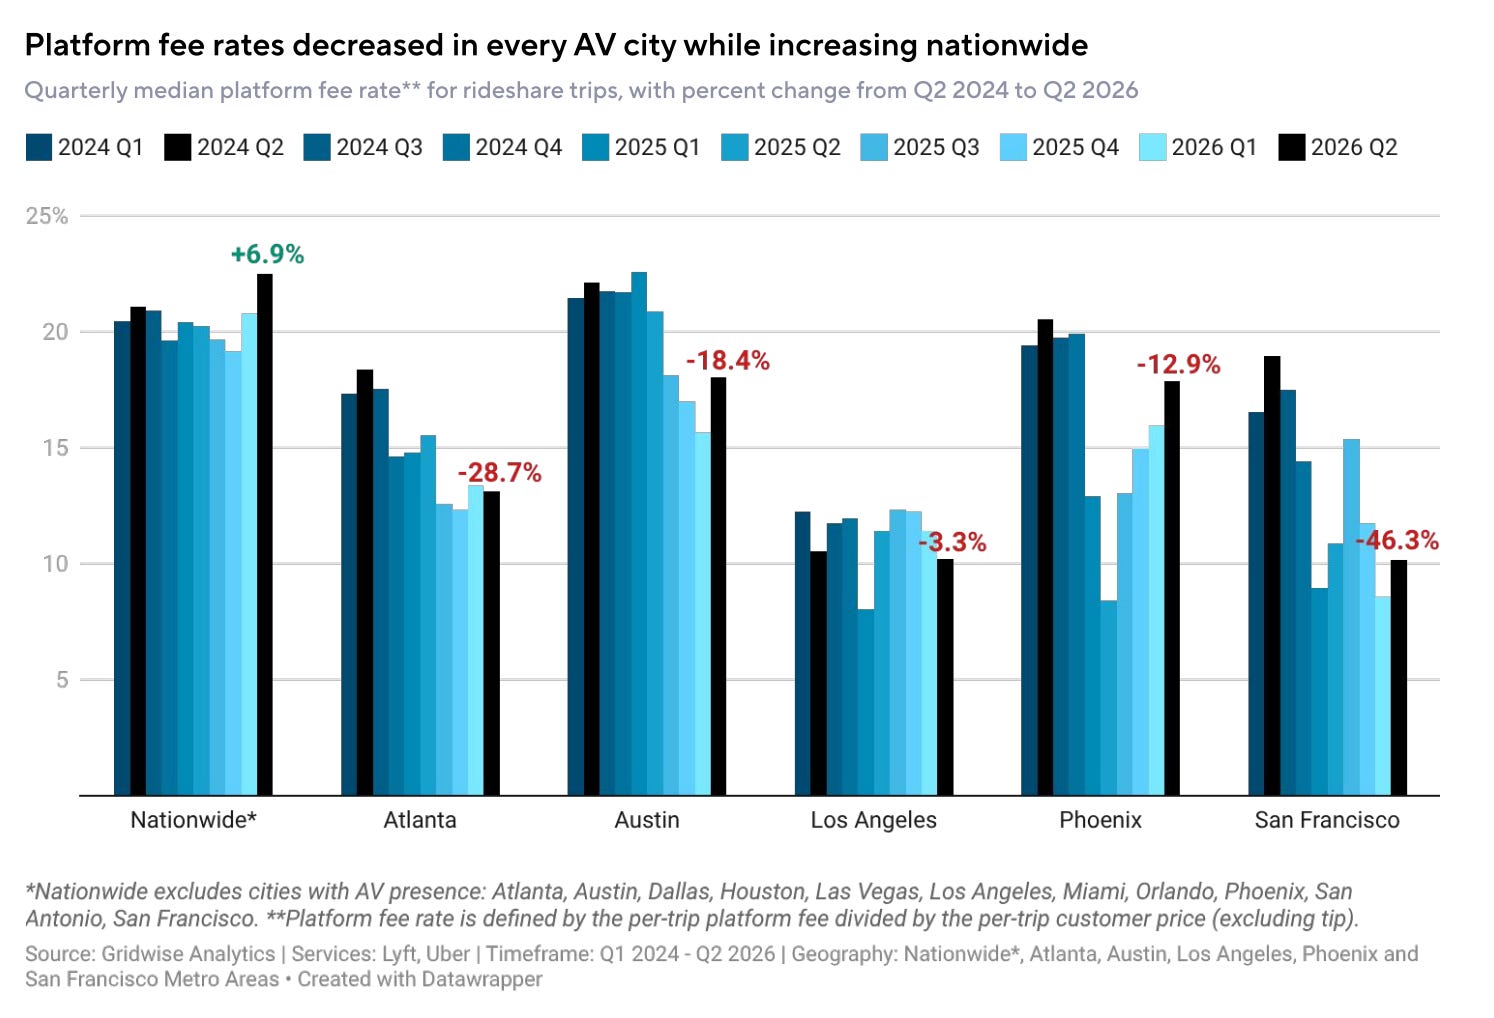
The median platform fee rate - the percentage of each customer fare retained by Uber and Lyft - fell in all five AV cities between Q2 2024 and Q2 2026, while rising 6.9% nationwide.
San Francisco saw the largest decline, with its rate falling 46.3%, from 19.0% to 10.2%. Atlanta followed with a 28.7% drop, while Austin fell 18.4%, Phoenix 12.9% and Los Angeles 3.3%.
Platform Fees Fell in Three AV Cities, but Rose Nationwide
Platform fees are the actual dollar amount Uber and Lyft retain from each ride, rather than the percentage of the fare.
Between Q2 2024 and Q2 2026, the median platform fee fell in San Francisco, Atlanta and Austin. San Francisco saw the biggest drop, with the median fee falling 47.1%, from $3.10 to $1.64 per trip. Fees fell 19.1% in Atlanta and 8.1% in Austin.
In Los Angeles, the median fee remained unchanged at $1.87 per trip, while in Phoenix it increased by 1.1%. The trend was different nationwide: excluding AV cities, the median platform fee rose 19.2%, from $2.97 to $3.54 per trip.
Riders Aren’t Seeing Matching Price Cuts Though
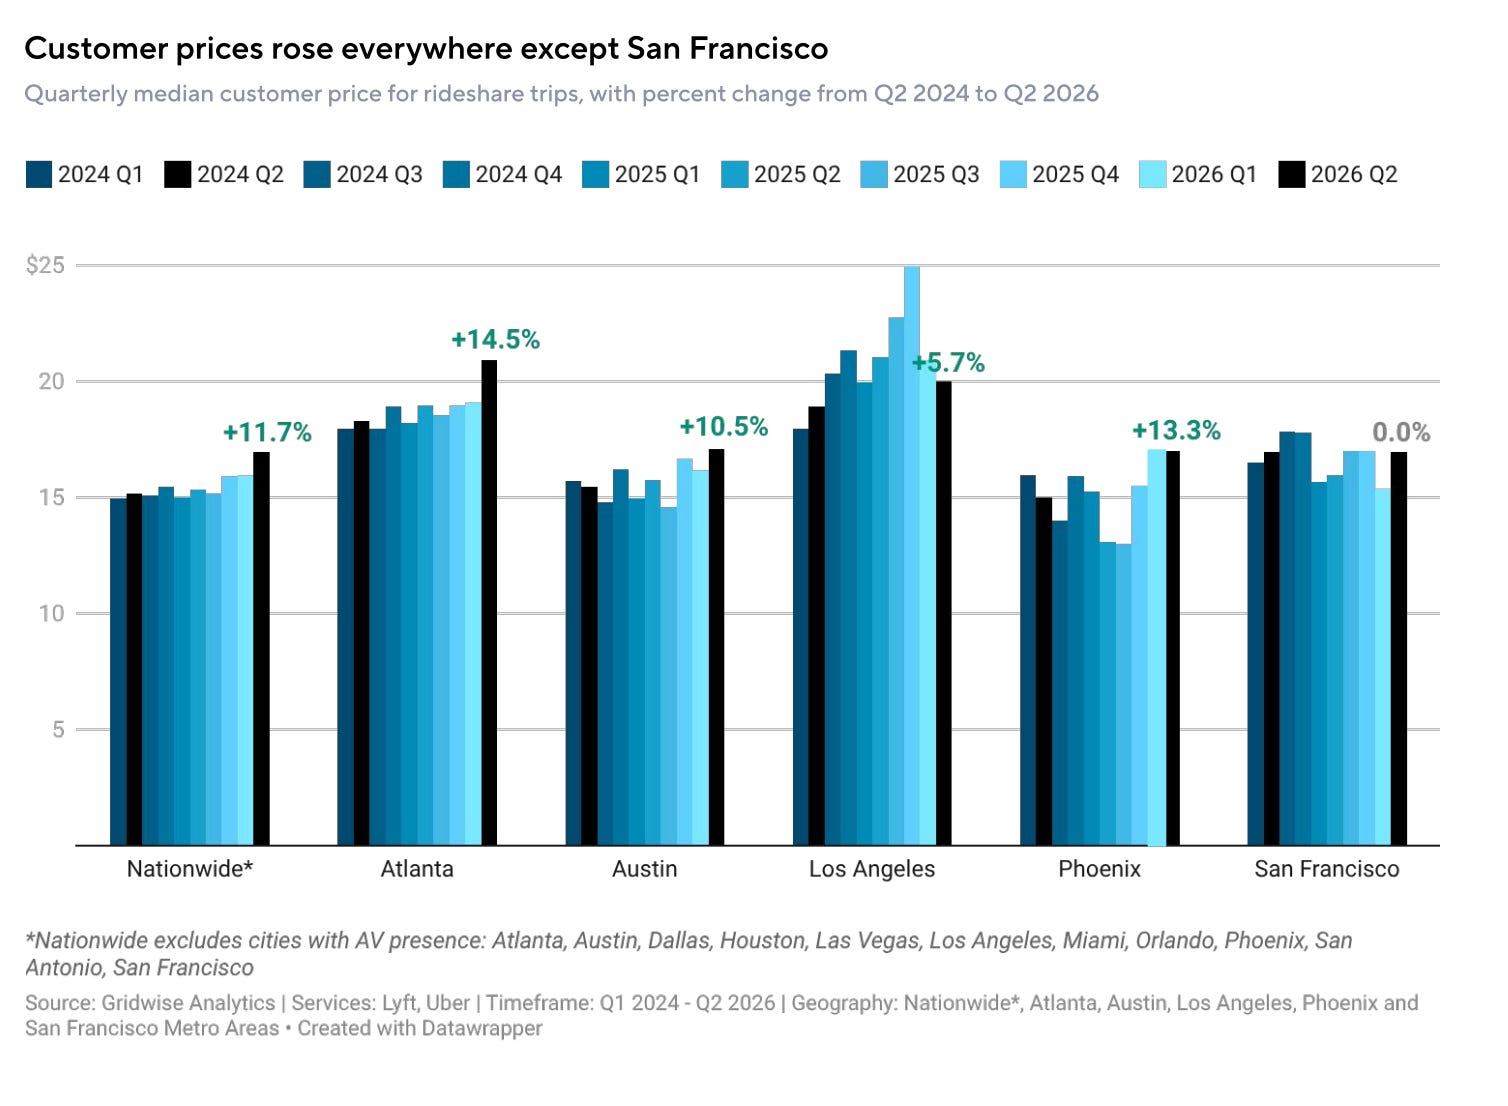
Lower platform fee rates have not translated into lower prices for riders, at least not yet. Median fares increased in four of the five AV cities, while remaining flat at $16.95 in San Francisco, compared with an 11.7% increase nationwide.
In Austin, where Tesla launched its Robotaxi service alongside Waymo, Uber and Lyft’s median platform fee rate fell 18.4%, even as rider fares increased 10.5%.
One possible explanation is that drivers are capturing a larger share of each fare, rather than the savings being passed on to riders. It’s also possible that competition from robotaxis is helping slow fare increases that would otherwise have been even higher.
Incentives Are Down 56%. Bonuses Nearly Tripled
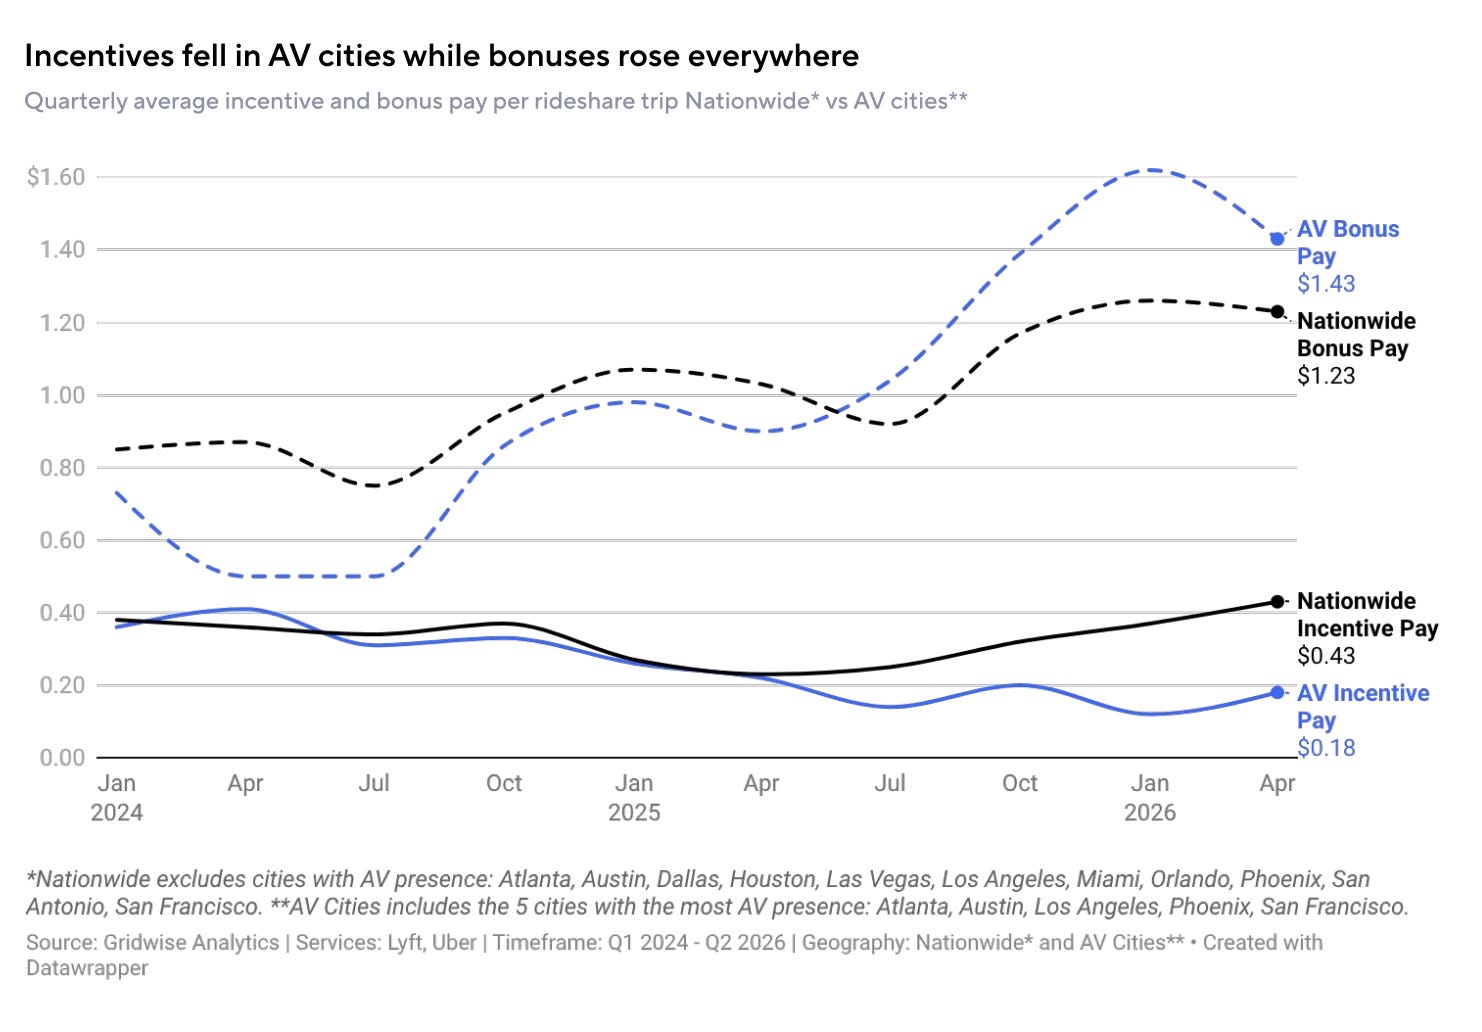
The way drivers are paid is shifting too. Incentives are additional payments designed to encourage drivers to work at certain times or in particular areas, while bonuses are extra payments linked to meeting targets or completing a set number of trips.
Across the AV cities, average incentive pay per trip fell from $0.41 to $0.18, a drop of 56.1%. Average bonus pay per trip rose from $0.50 to $1.43, up 186%. Nationwide, both went up: incentives by 19.4% and bonuses by 41.4%.
Trips Per Hour Keep Slipping, But Pay Per Hour Is Up
This picks up the story from our March coverage. From Q2 2024 to Q2 2026, median trips per work hour fell 3.1% across the AV cities, from 1.63 to 1.58, compared with a 1.2% drop nationwide. Trips per hour fell more than the national figure in four of the five cities. Phoenix was flat.
The good news for drivers is that fewer trips per hour didn’t mean lower hourly earnings. Median hourly gross pay, excluding tips, rose in all five AV cities because pay per trip rose. Driver utilization, the share of time spent with a passenger, fell in all five cities but remained higher than the national figure.
Hourly Pay Is Up Everywhere, But Quarterly Pay Is A Mixed Bag
So what does all this mean for what drivers actually take home? The answer depends on the city, and on how many hours drivers put in. Median hourly gross pay, excluding tips, rose in all five cities, but quarterly gross pay varied: San Francisco was up 16.1%, while Austin was down 17.7%. The reason is work hours: in Austin and Los Angeles, median hours worked fell 24.3% and 17.8%, which Gridwise says likely contributed to lower quarterly pay. In Phoenix, hours rose 17.4%.
The report can’t say why drivers in Austin and Los Angeles worked fewer hours, or whether the same drivers are behind the figures in both periods. Our March article, which covered a different time window, found hourly earnings pressure in several AV markets. This report doesn’t contradict those findings. It shows a two-year picture in which hourly pay is up and the main risk to take-home pay is fewer hours.
What We Heard at the Urban Autonomy Summit
The report came up on our panel at the Urban Autonomy Summit in Austin, where Gridwise’s Brandon Sellers, VP of Marketing, who is credited with growth and market strategy on the report, spoke about the findings. It really stood out, particularly the platform fee data. You can watch the full panel here.
So What Is Behind the Change?
Gridwise is careful here. Its read is that lower fee rates and higher gross pay per trip across all five cities are consistent with the possibility that increased competition, including from AV services, is affecting how revenue is split on human-driven rides. But it says the data can’t separate AV deployment from other factors, and some trends, such as the rise in premium rides, show up nationwide too.
The ride mix is shifting as well. Premium rides, such as Comfort, XL, and Black, grew as a share of trips in all five cities, led by San Francisco (10.6% to 19.7%) and Atlanta (12.3% to 20.3%). Nationwide, premium share rose from 10.8% to 15.9%.
What This Means For Drivers
The findings aren’t a simple good-news or bad-news story. Here’s what matters:
Watch your hours, not just your hourly rate: Hourly pay rose in all five cities, but quarterly pay ranged from up 25.9% in Phoenix to down 17.7% in Austin. Hours worked made the difference.
Pay attention to the pay mix: Incentives are shrinking and bonuses are growing in AV cities. Know which one your market is leaning on, and what it takes to qualify.
Consider premium rides: Premium trips are a growing share of the work in every AV city.
Track your own numbers: City-level medians won’t match your shifts. Compare your own trips per hour, fees and earnings against what’s happening locally.
My Take
Last time the story was about productivity. This time it’s economics: in the cities where robotaxis operate, Uber and Lyft are keeping a smaller share of each fare, and they’re leaning on bonuses rather than incentives to pay drivers.
This pattern fits what you would expect when a market gets a new competitor, and Gridwise says as much. But it’s worth being clear about what it does not show. Riders have not seen prices fall, since customer prices rose in four of the five AV cities, and Austin and Los Angeles drivers are working far fewer hours.
Two years of consistent direction on fees across all five cities is hard to ignore, even if the cause can’t be proven. With more launches announced for 2027 and 2028, this is the data set to watch.