
What CPUC Data Reveals About Waymo’s Deadheading and Utilization

Waymo has been racking up some major milestones lately. One of the biggest according to new California Public Utilities Commission (CPUC) data: the company is now providing about 1 million paid rides per month in California. Here’s how that growth has played out over time1.
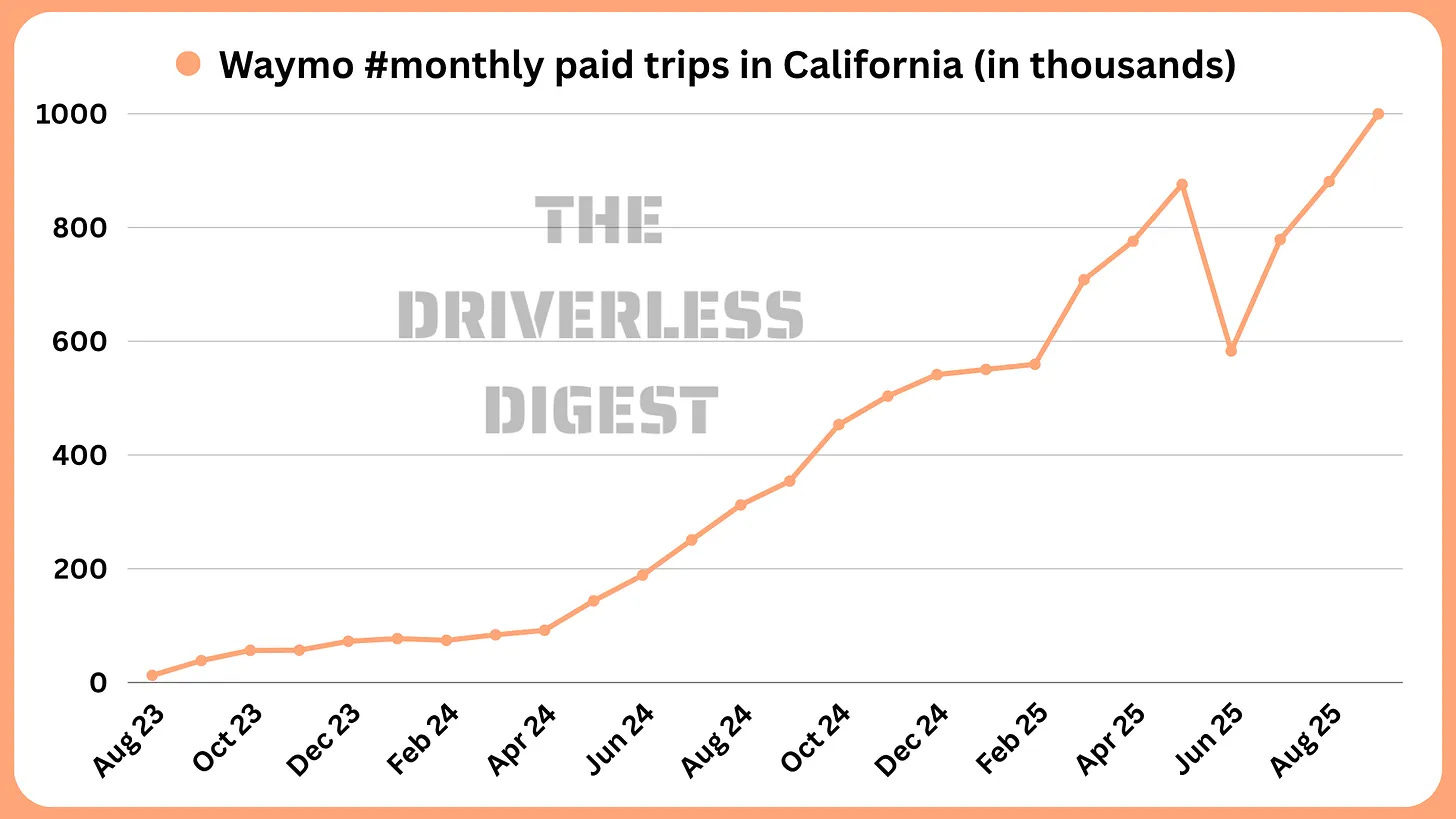
Waymo’s California trip volume has grown roughly 3x over the past year and 26x over the past two years. And while Waymo shares occasional updates, its AV permit requires quarterly reporting to the CPUC, which gives us a more consistent view of activity. Recently, I came across a LinkedIn post from UC Berkeley researcher Matthew Raifman that dug deeper into the latest CPUC data release, specifically looking at Waymo’s deadheading miles.
What is Deadheading?
In the Transportation Network Company2 (TNC) world, “deadheading” refers to miles driven without a passenger onboard. So for both Uber/Lyft and robotaxis, the California Public Utilities Commission (CPUC) breaks this activity into four periods:
P0: Vehicle is offline and not available for rides
P1: Idle or waiting after completing a trip, before accepting the next one
P2: En route to the passenger after accepting a trip
P3: Passenger onboard — the actual trip
Most revenue for fleet operators is generated during P3, when the vehicle is transporting a passenger. That’s why minimizing deadheading is so important. A familiar example for Uber drivers is a long ride — say 60 minutes or more — to a low-demand area. After dropping off, the driver may need to travel 20–30 empty miles and spend another hour getting back to a busy zone. What looked like a great trip on paper often ends up far less profitable once the deadhead miles are factored in.
Waymo’s Deadheading VMT Share
Here’s what Waymo’s Vehicle Miles Traveled (VMT) for deadheading looks like for P1, P2 and combined3.

Looking at the CPUC data, a few things immediately stand out. Deadheading has improved from 51.5 percent in January 2024 to 44.3 percent in September 2025, but it’s striking how much of that still comes from P1. In recent months, roughly two-thirds of Waymo’s deadhead VMT in California falls into P1.
In my experience during peak demand, Waymo always feels busy — high ETAs and lots of activity — which would imply very little P1 time and more P2 time as cars hustle to riders. And that’s probably true during those peak windows. But the CPUC numbers reflect activity across all hours, and it appears that off-peak periods are doing most of the heavy lifting here. During slower times, the cars seem to rack up a lot more P1 miles — likely from repositioning, cruising, or simply having to stay in motion — which ends up pulling the overall averages upward.
Ideally, P1 should be as close to zero as possible, since all you’re doing in that period is waiting for the next trip. With a fixed fleet size though, Waymo may be forced to reposition more after drop-offs — or simply keep moving because there aren’t many legal places to wait. At a high level, the data suggests their fleet spends a lot of time driving around between trips while waiting for a request, rather than staying put, which is why P1 miles remain so high.
The good news for Waymo though is that total deadheading is trending down and as their fleet density increases, I would expect that number to come down even further. But for now, their P1 deadheading is a lot higher than I would have expected.
Readers, what do you think about Waymo’s deadheading numbers and VMT?
-Harry
This is the first of a two-article series. You can find the second article, by guest author Dr. Matthew Raifman, here (link).
If you’re wondering what the heck happened in June 2025, the number of trips went down because the company paused service in Los Angeles and San Francisco due to anti-Immigration and Customs Enforcement (ICE) protests that involved vandalism of their vehicles.
i.e., Uber, Lyft, Waymo, etc.
Thank you Matthew for sharing the data in a handy spreadsheet.
They’re definitely in sore need of muster points for the vehicles to hang out close to busy zones while not being called to a trip. Gotta imagine that’s what regional ops is focusing on.
Wow, that's absolutely apalling. I really hope these technologies do not get wider adoption with those metrics because the effect on the roads feels pretty bleak.