
How Waymo Spends Its Time Between Trips

This is the second of a two-article series. You can find the first article here (link). Today’s post comes from Dr. Matthew Raifman, a transportation researcher at UC Berkeley who studies how automated vehicle systems impact safety, sustainability, and urban mobility. He offers this analysis in a personal capacity and his title is used for the purpose of identification only.
Autonomous ride hailing is here and it is picking up steam. As Waymo, Zoox, and others expand their initial markets in California, Arizona, and beyond, lingering questions remain about the societal implications and operational efficiency of these nascent AV services.
In an earlier analysis of the California Public Utility Commission’s (CPUC) Autonomous Vehicle Deployment data, I focused on Waymo “deadheading” aka the miles-traveled by AVs without a passenger. These additional miles-traveled carry with them potential contributions to congestion, brake and tire emissions, and other negative societal impacts while also being an indicator of baked-in inefficiency in the ride hail market. These previous analyses were based on vehicle miles traveled (VMT) though.
Today, I’m taking a deeper look into the other side of the proverbial coin of inefficiency: time.
First, let’s recap the way that CPUC reports deployment data. They break down an AV trip into three periods:
P0: Vehicle is offline and not available for rides
P1: Idle or waiting after completing a trip, before accepting the next one
P2: En route to the passenger after accepting a trip
P3: Passenger onboard — the actual trip
P1 is what we’re going to focus on today since manufacturers deploying AVs for revenue generating passenger trips are required to report the monthly aggregated time elapsed between the end of a previous trip (defined as: passenger drop off at the end of P3) and the beginning of the next trip (defined as the beginning of P2) to the CPUC. In other words, “waiting time” is the time when an AV is unassigned and either parked or driving around (P1).
Total Waymo Waiting Time between Trips
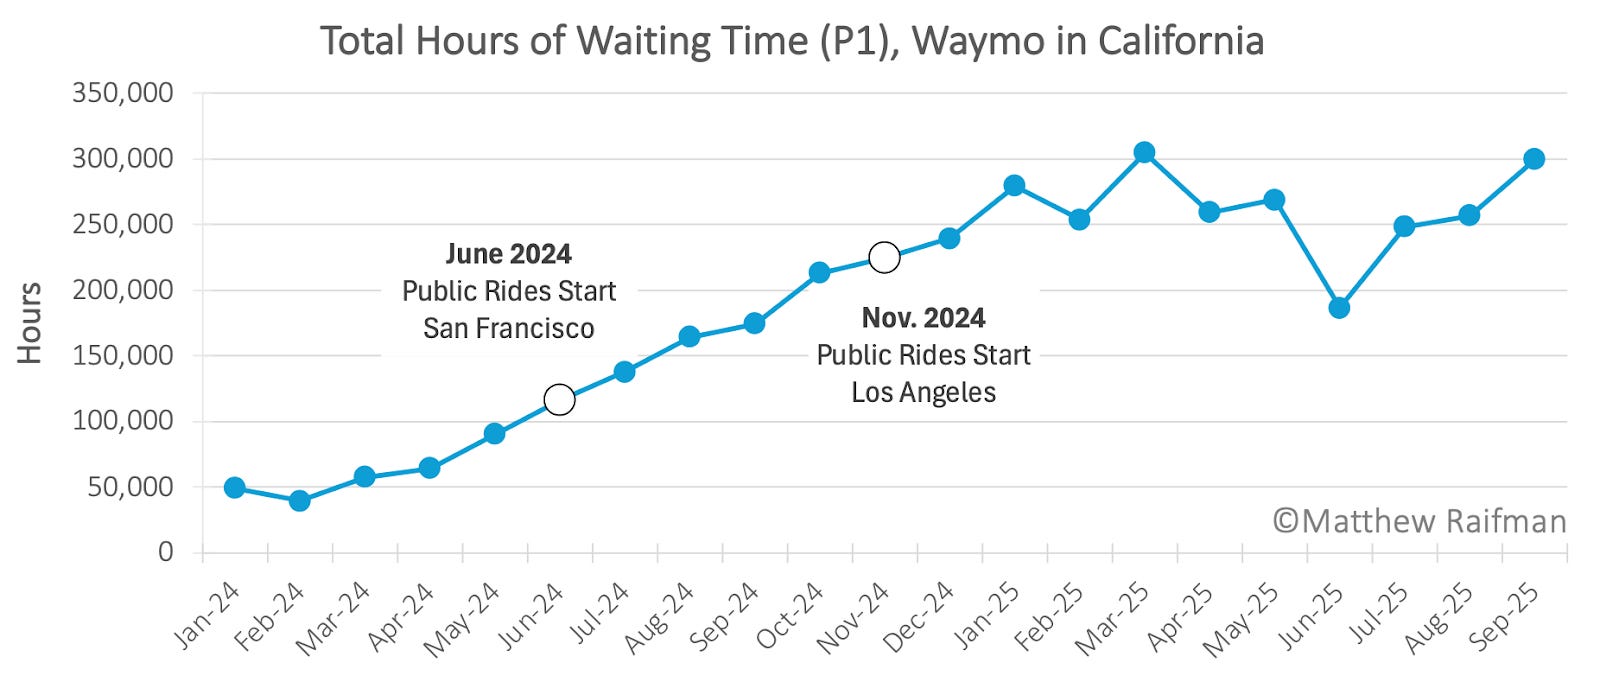
1 Examining the cumulative hours waiting over time, it is a bit staggering just how much time Waymos are spending without a passenger or even assigned to pick one up. Peaking in March 2025 with over 304,000 hours, the California Waymo vehicle fleet is spending the equivalent of 12,700 days every month operational but without an assigned passenger trip.
If we assume 1,000 Waymos were deployed for public rides during this period (on the conservative side given recent fleet announcements), that ends up being around 12.7 days2 of waiting per vehicle per month. Further, the bias here is to be forgiving, as Waymos are not operational 24 hours a day.
Your interpretation of this data may differ based on your perspective. On the one hand, compared to personal vehicles, that is actually pretty good. According to National Household Travel Survey data, personal vehicles spend 95% of their time parked (yes, you read that correctly). Compared to public transit, Waymo’s performance is undoubtedly quite poor as the average P1 time for transit agencies is extremely low; one study estimated only 13% of transit bus VMT was deadheading (P1+P2). Compared to Lyft/Uber? Well, it is tricky and worthy of another post. Choices like opting out of service when waiting and operational zone differences complicate a comparison. However, research from Parrott & Reich found that, in Seattle, Lyft and Uber drivers spent 35-40% of time without an assignment, generally in the ballpark of Waymo’s performance.
Waymo Waiting Time per Trip
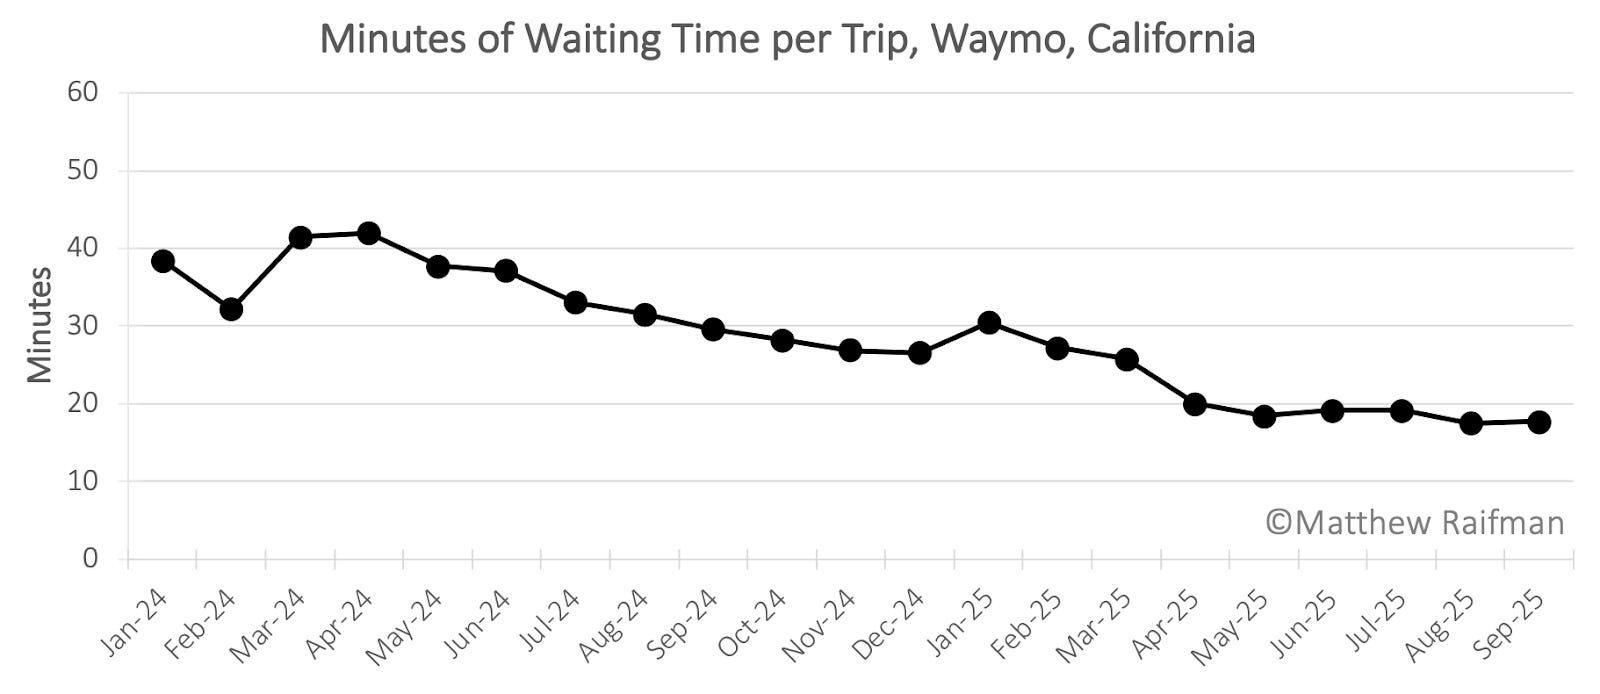
For an operational perspective, we can also look at the amount of waiting time per passenger trip. (Note, I have adjusted the y-axis to minutes now that we are looking at trip data). From my perspective, the waiting time chart below looks exactly as we would expect. From 2024 to 2025, Waymo dramatically increased passenger trips in California from just over 77,000 trips in January 2024 to over 1,000,000 trips in September 2025 (our most recent data point) based on CPUC data3.
As passenger trips increased, waiting time (again, defined as idling time and time driving without a trip assignment) has more than halved from 38.4 minutes in January 2024 to 17.7 minutes in September 2025. This represents efficiency gains for the company. It could be driven by changes that have improved utilization like: fleet size, when vehicles are switched on for trips, and better allocation of resources.
Both ways of visualizing and thinking about the waiting time data matter. Aggregated waiting time for the Waymo fleet provides insights into the scale of time Waymo is operational without direct public good. This is time on the road driving (P1 VMT) and time parked in a spot (idle P1 time). Per-trip waiting time provides us insights into the operational efficiency of the Waymo fleet. Waymo is getting more efficient over time. Improving operational efficiency can drive improvements in social benefits too.
Breaking out Waymo Parking Time
Finally, we can explore perhaps a more interesting question but challenging one to answer: how much time do Waymos spend parked? While the CPUC data does not directly report this, we can estimate the amount of time Waymos are parked and not moving if we assume their travel speed when moving.
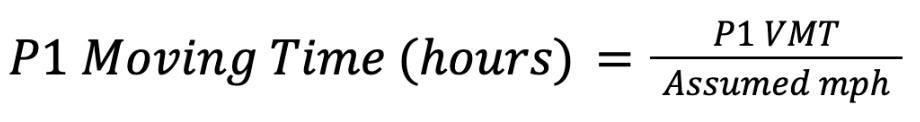
P1 Parking Time (hours) = Total Waiting Time (hours) — P1 Moving Time (hours)
First, we have to assume a reasonable travel speed for P1 travel. I used 14 miles per hour for this analysis. Why? Well, as of recently, the average travel speed in San Francisco was 12 mph. Given that Waymo operates in the Bay Area and L.A., where speeds are likely faster, 14 mph seemed like a cautiously low assumption. If we assume a higher speed, the amount of parking time goes up. Then we can simply plug in P1 VMT and Total Waiting Time from the CPUC data to the equations above. Using this approach, we can estimate how much time Waymos were moving for P1 travel. The Parking Time is assumed to be Total Waiting Time minus Moving Time. Note: I make the assumption that Waymo takes vehicles offline (moving them to P0) for return to depot trips, like for EV charging or cleaning.
(All calculations are available here)
One of the most interesting things to look at is how Total Waiting Time (i.e. P1) is split between moving and parked, and how this changes over time. In short, the way Waymo spends time in between passenger trips has shifted. Back in early 2024, four out of five waiting hours between trips were spent parked. As demand has increased, and presumably Waymo has become more knowledgeable about demand patterns, the company is spending more of that P1 waiting time in movement. This could be evidence of improved redistribution between trips and confidence in demand modeling. It also means that Waymos that are in between trips are now spending about half their time parked and half their time in movement. Whether it’s better from a societal perspective to have an unoccupied vehicle taking up a parking space or driving space is up for debate.
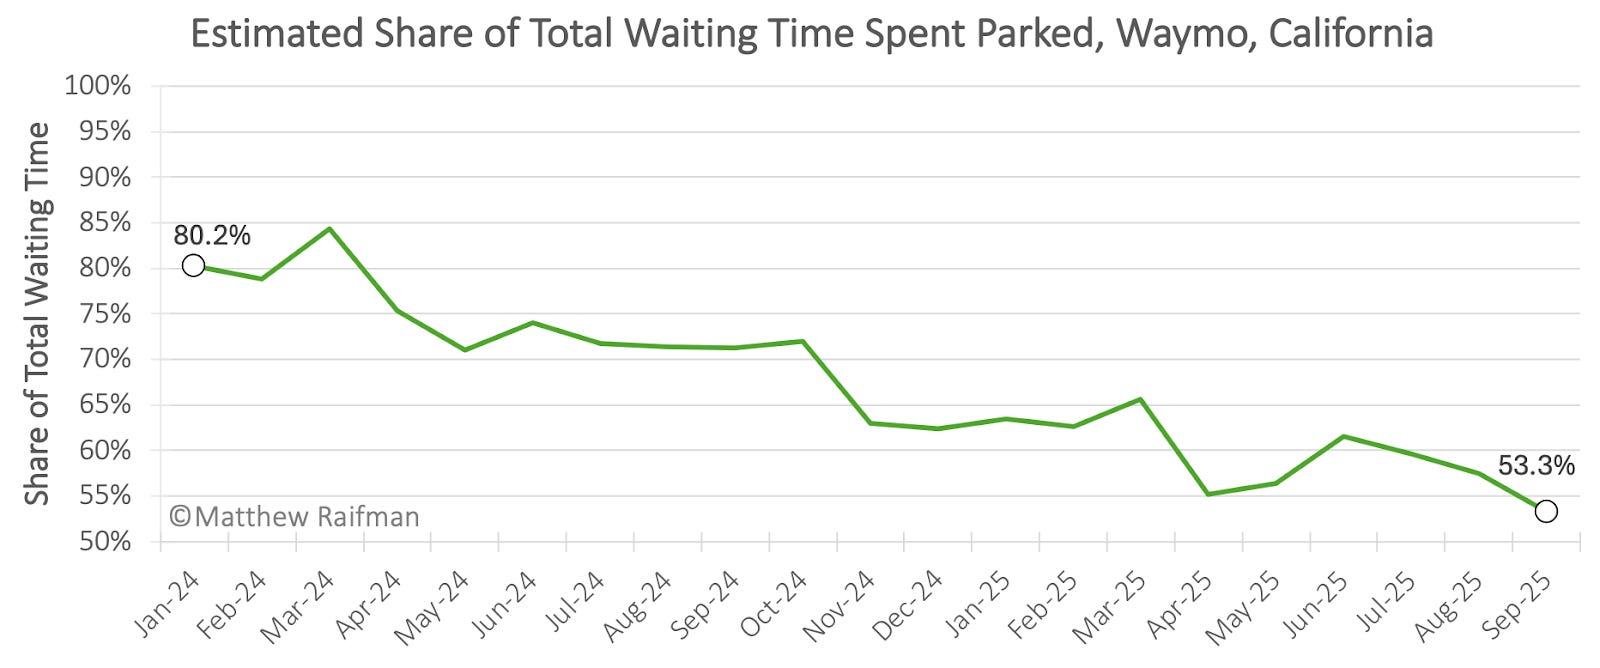
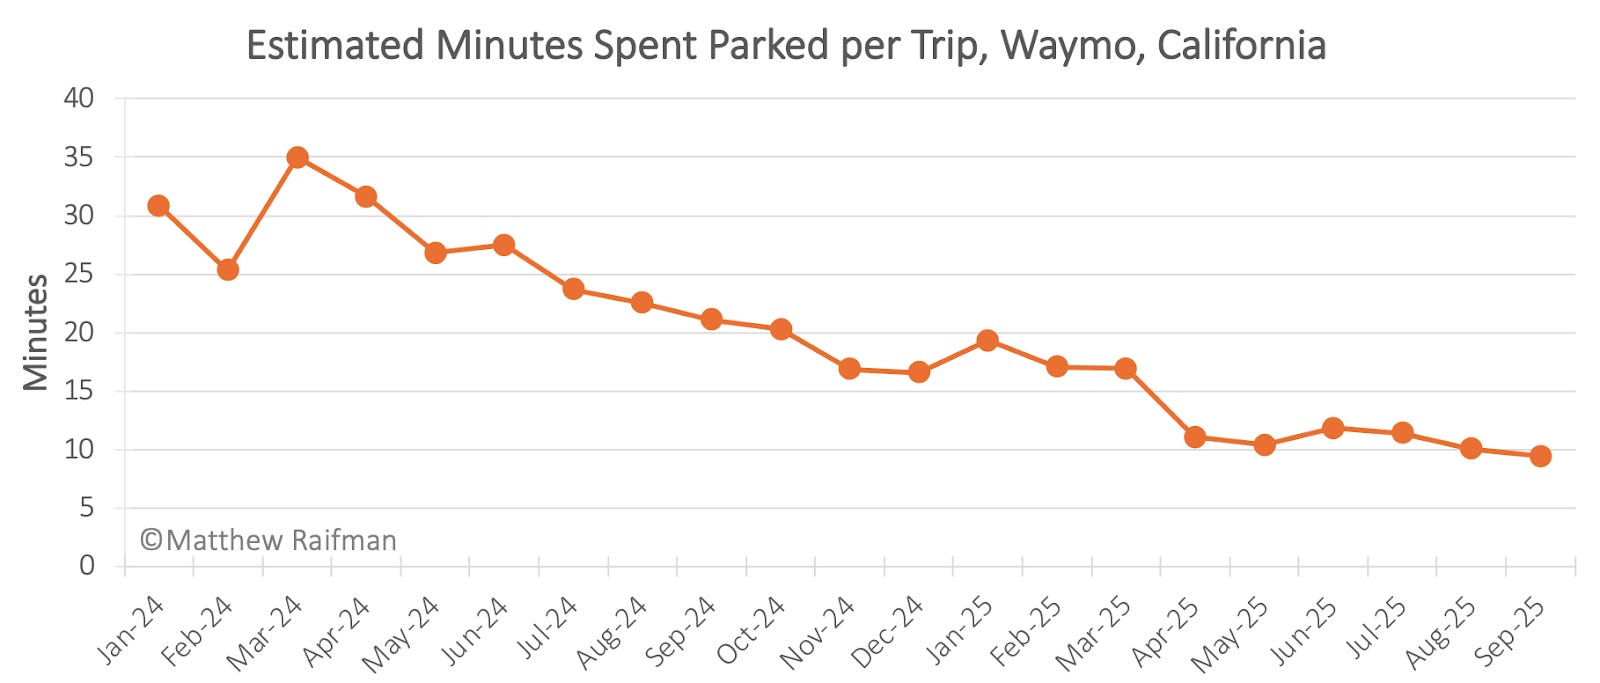
In aggregate, however, the same story from above comes through here. Waymos are spending a lot of time parked in the cities they operate in. If you buy my assumption that Waymos are traveling at an average of 14 mph, Waymos spent nearly 160,000 hours parked while operational in California in September 2025. Yes, the number of minutes parked between trips has declined considerably from 31 minutes per trip in January 2024 to 9.4 minutes in September 2025, but all that idling in place over 1 million trips adds up to a lot of space taken up on the side of the road.
This leaves us with a lingering question: is it “better” for AVs to be parked or driving around when they do not have a trip assignment? From a societal perspective, I do not think it is completely clear which is preferable. Sometimes parking may be preferable, assuming Waymos are parking in legal locations and paying for spots when at metered locations (which would require a seamless, backend curb management solution). Sometimes driving may be preferable, particularly in business districts where parking is particularly scarce. From the business perspective, I would imagine that smart reallocation of assets during the P1 phase would reduce wait times for customers hailing rides and be preferable to parking and waiting.
If I were to sum up this waiting time analysis, I would say that Waymo’s impact is substantial and changing rapidly. We can see that the scale of Waymo waiting time in California and that scale may have considerable impacts on congestion and parking space, especially when Waymo service is considered additional on top of existing transit, micromobility, and personal vehicle options. On the other hand, we can see that Waymo is rapidly evolving and waiting time per trip has dropped considerably over the past two years. This will be an interesting area of data to follow as Waymo expands and as Zoox and other AV ride hail solutions come online for public trips.
What we do not know from the data?
The CPUC requires quarterly data submissions from AV companies with vehicles deployed for revenue-generating trips, but that data is heavily redacted. As a result, we do not know several things that are important follow up questions to this analysis. It would be nice to confirm that Waymo is reporting P1 waiting time data exactly as stipulated by CPUC in their data dictionary.
We also do not know Waymo’s conditions for switching a vehicle on for service or not, or where Waymo is parking during those non-moving waiting time hours. For example, is Waymo counting idle charging time at its depot as waiting time? Or switching the vehicle off for service before undertaking a charging trip to the depot? These questions matter because they inform the discussion of public impact. Arguably, a Waymo parked at a privately leased depot is different from a Waymo parked and idling in a public parking spot for free.
Readers, what do you think about the data on Waymo’s waiting time? And is it better for Waymo to park or drive around while they’re waiting for a trip?
Thank you to Dr. Raifman for his guest post on this important topic.
Waymo paused service in June due to ICE protests in SF and LA.
304,000 hours / 24 hours a day = 12,666.67 days a month. 12,667 cumulative days a month / 1,000 Waymos in circulation = 12.7 days of waiting time per vehicle per month.
You can download the raw data from the CPUC’s Deployment Program Quarterly Reports page. Just click the hyperlink for any reporting period to grab the ZIP file. Inside, you’ll find monthly driverless trips and VMT data labelled ‘month level deployment’, under Public driverless deployment. The same process works for pretty much every quarter on the page, with only small possible variations for some - Video Guide
 | A guest post by
|
Great work!
All else being equal, I think it is almost always preferable (from a societal perspective) for an empty AV to be parked rather than cruising. In both cases, the vehicle is occupying valuable public space. However, the cruising vehicle consumes more energy, emits more pollutants, occupies more space, and increases the risk of collisions for other road users.
To your point about curb space being scarce in business districts, when (and where) curb space is scarce, road space is also scarce, except for around 10-11:15am when demand for AV ridehailing in business districts is also minimal.
Looking at it from another perspective: AV fleet operators are definitely repositioning their vehicles to meet anticipated demand. Because they don't internalize the costs of emitting pollutants or occupying public space (but do internalize energy costs and the risk of collisions), and they don't have to pay for road use, I would expect them to spend more of their P1 time cruising/repositioning than the social optimum.
We recently did a related study, funded in part by Waymo. We analyzed how curb parking restrictions for SAVs in SF would affect VMT, curb usage, customer wait time, and request matching rate. https://papers.ssrn.com/sol3/papers.cfm?abstract_id=5526419
Great work! Now do TNCs, noting that the P1 and P2 times for every human-driven car affect the driver:
1. they are sitting
2. they are breathing air pollution
3. for P0, they are stuck not earning
4. for P1, they are risking a collision
5. their car is depreciating